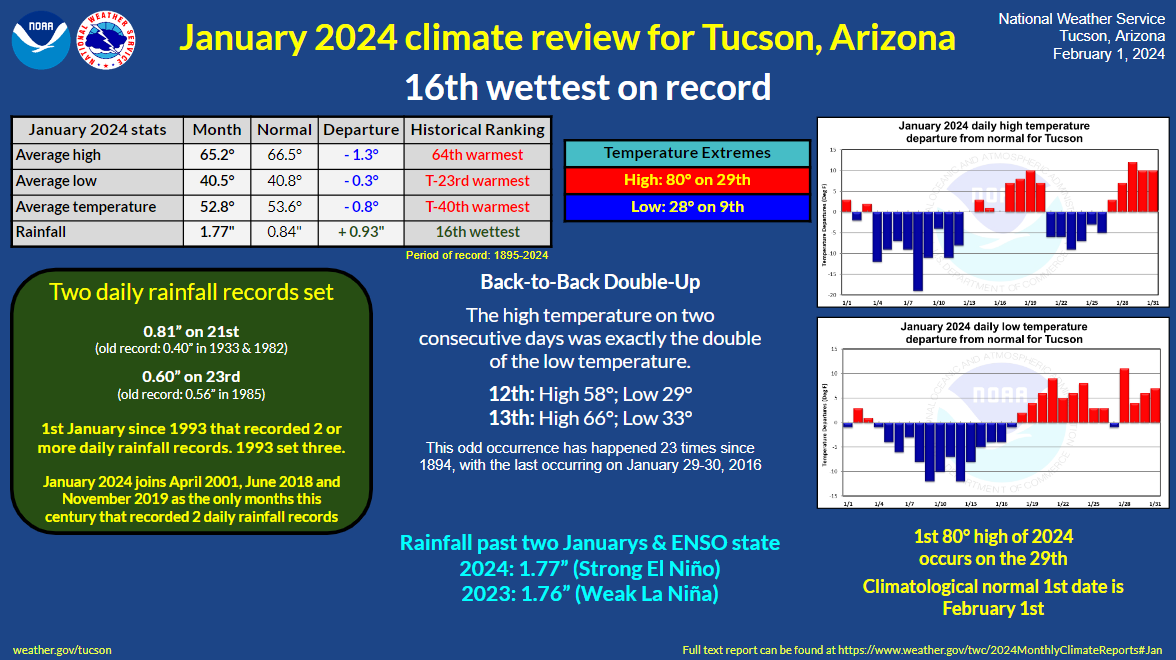
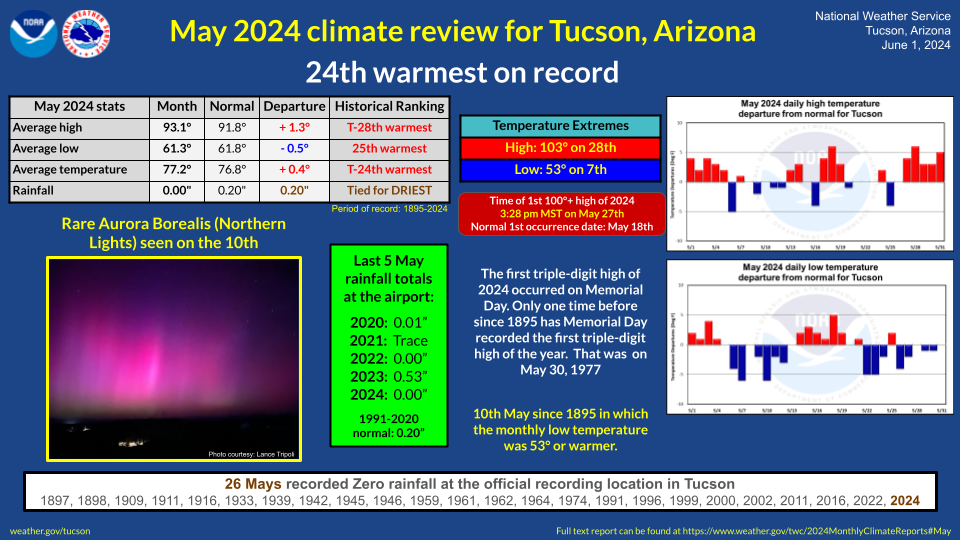
| February 2024 climate report for Tucson |
| 26th warmest and 24th wettest on record |
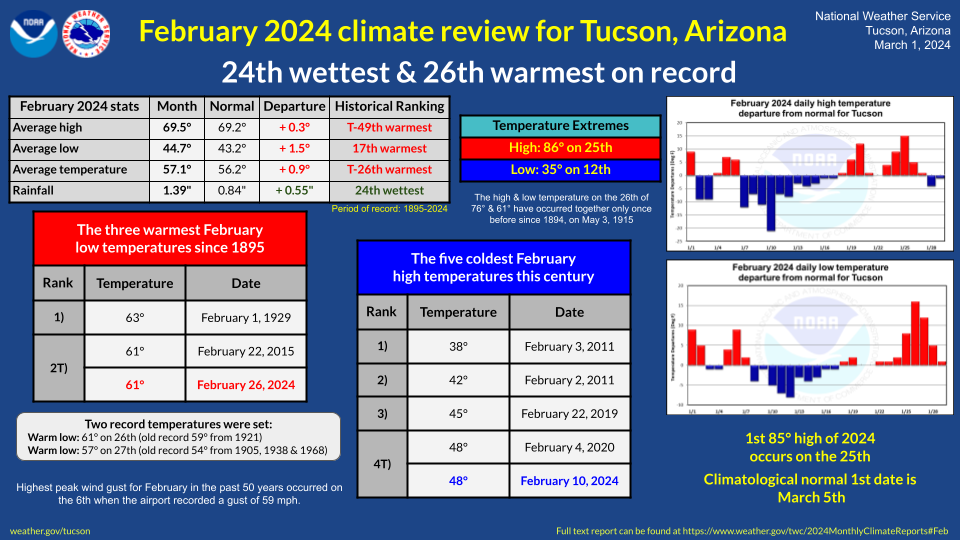
| Highest February peak wind gust in the past 50 years |
| 2nd warmest February daily low temperature |
| First 85°+ high of 2024 occurs on 25th |
| |
|
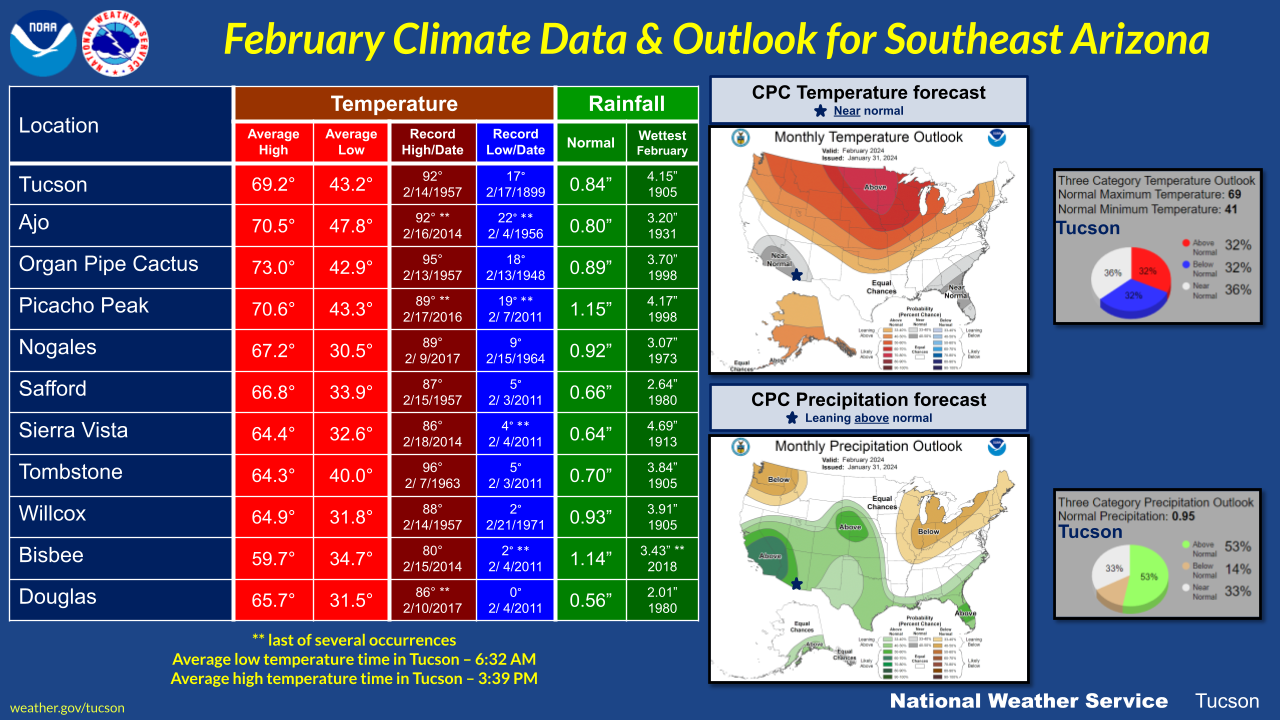
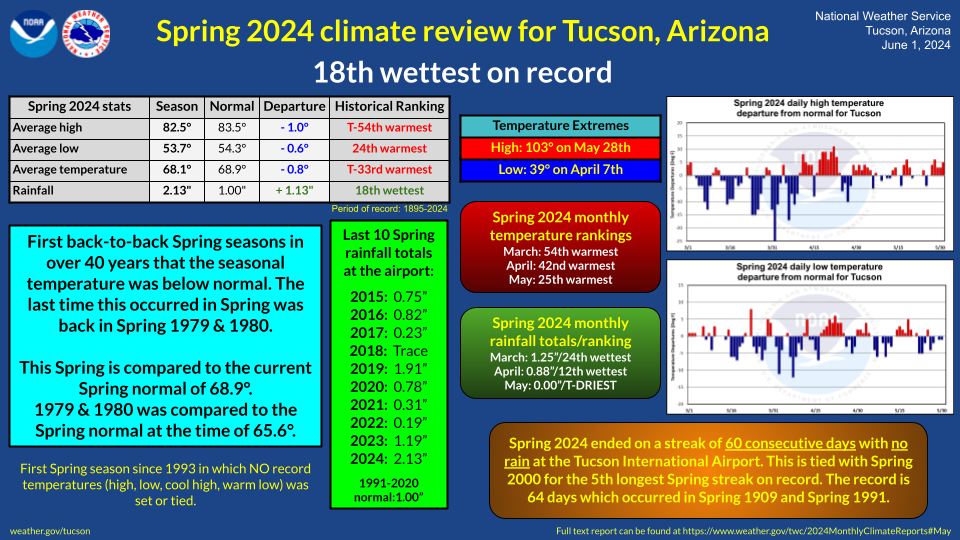
The February outlook for Tucson, issued on January 31st by the Climate Prediction Center, favored above-normal total precipitation amounts (52% above vs 15% below) and favored near-normal monthly mean temperatures (36% near Vs 33% for both above and below). The month was split into two periods, a wet first 11 days then a mostly dry and warm remainder of the month.
|
| |
|
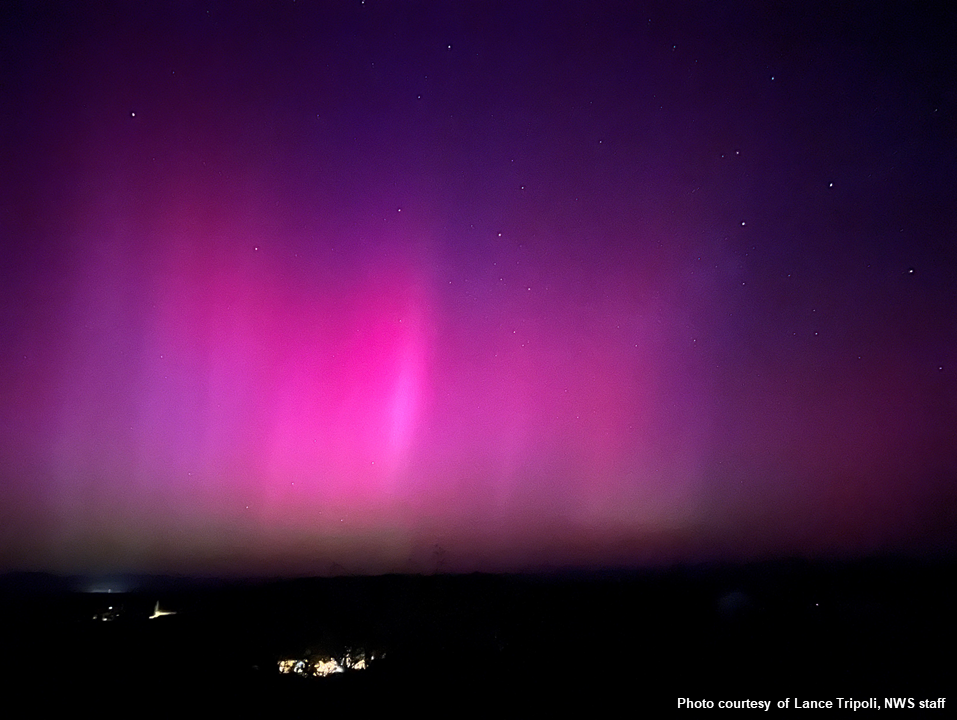
The first 11 days of the month were active as several winter storms moved across the area with rainfall occurring across the metro areas every day except for on the 4th and 5th. A thunderstorm on the 2nd produced brief heavy rain and pea-sized hail. On the 6th, strong gusty winds occurred in advance of another winter storm. The airport recorded a peak gust of 59 mph which is the highest February gust in the past 50 years. The coldest storm of the month impacted the area on the 10th with widespread valley rain and a little snow, mainly across the southeast portion of the metro area including Vail. The high temperature on the 10th of 48° was the 4th coldest February high this century.
|
| |
| A dry and warmer pattern settled in from the 12th through the 20th with the 2nd 80°+ high of 2024 occurring on the 20th. After a brief cool down from the 21st through the 24th, temperatures warmed up once again with the 25th being the warmest day of the month. The low temperature on the 26th, thanks to cloud cover, only cooled down to 61°. This ranks as the 2nd warmest February low temperature on record, behind the monthly record of 63° which occurred on February 1, 1929. |
| |
| A pair of weaker weather systems brought light rainfall to the area on the 26th and 28th with a few thunderstorms rolling through the area on the 28th. |
| |
|
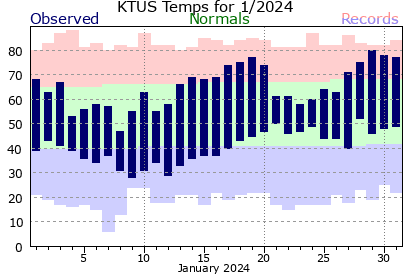
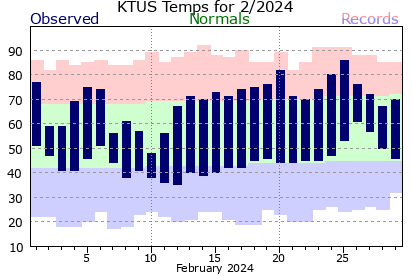
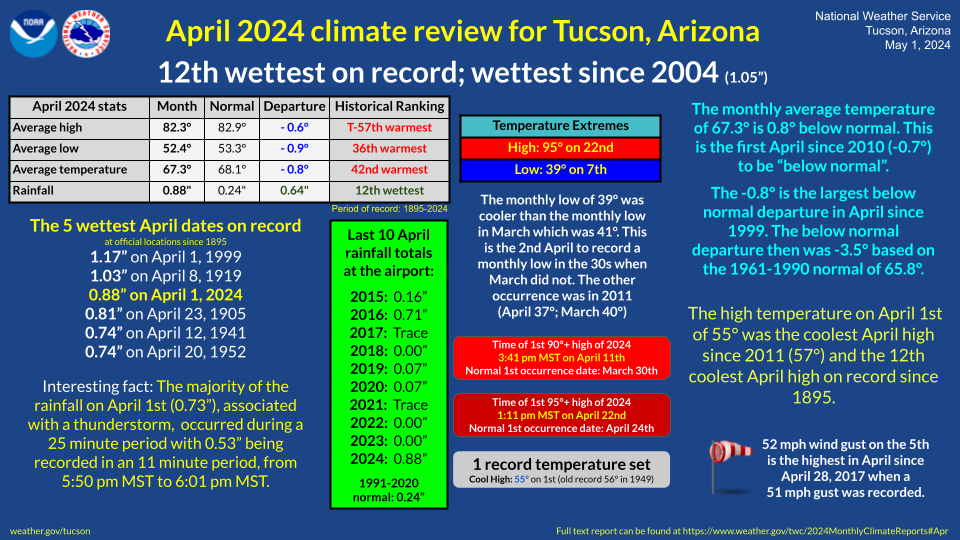
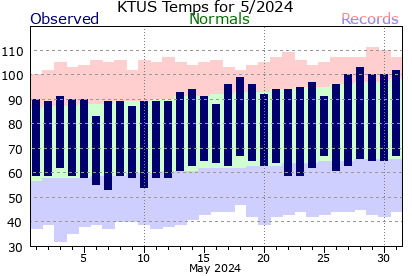
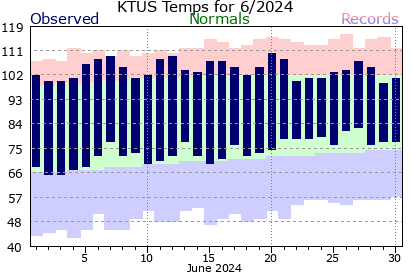
The monthly average temperature of 57.1° is 0.9° above normal and ranks as the 26th warmest February on record. Temperature extremes for the month ranged from a high of 86° on the 25th to a low of 35° on the 12th. This is the 26th February on record in which the official site didn't record a low temperature of 32° or colder. The last February that this occurred was in 2021. The high & low temperatures of 76° & 61° on the 26th have occurred together only once before since 1894, on May 3, 1915.
|
| |
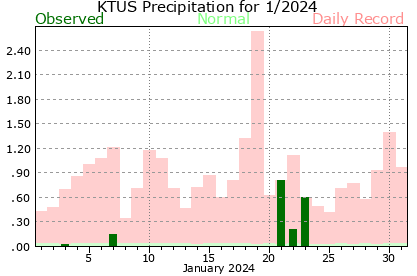
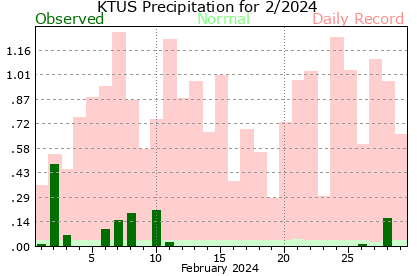
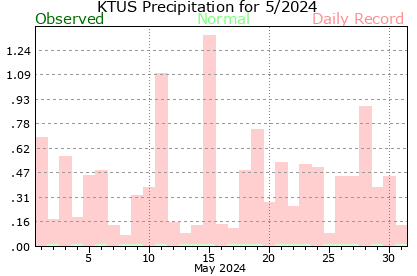
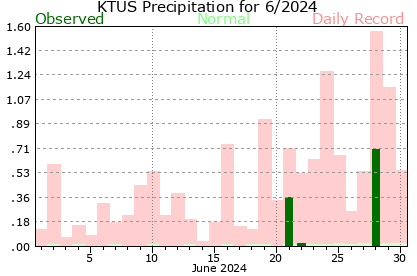
| Precipitation across the metro area, using several sources like rainlog.org, the Pima County Regional Flood Control District gages, and CoCoRaHS, ranged from 1.00" to 2.00" with localized spots up to 3.00". The International airport, which is the official recording spot in Tucson, recorded 1.39" which is a little over a half an inch above normal and ranks as the 24th wettest February on record. |
| |
| February 2024 stats |
Month
|
Normal
|
Departure
|
| Average high temperature |
69.5°
|
69.2°
|
+ 0.3°
|
| Average low temperature |
44.7°
|
43.2°
|
+ 1.5°
|
| Average temperature |
57.1°
|
56.2°
|
+ 0.9°
|
| Rainfall |
1.39"
|
0.84"
|
+ 0.55"
|
| # of days with lows 32° or colder |
0
|
2
|
- 2
|
|
Period of record: 130 years (1895-2024)
|
|
| |
|
| |
| Winter 2023-2024 climate report for Tucson |
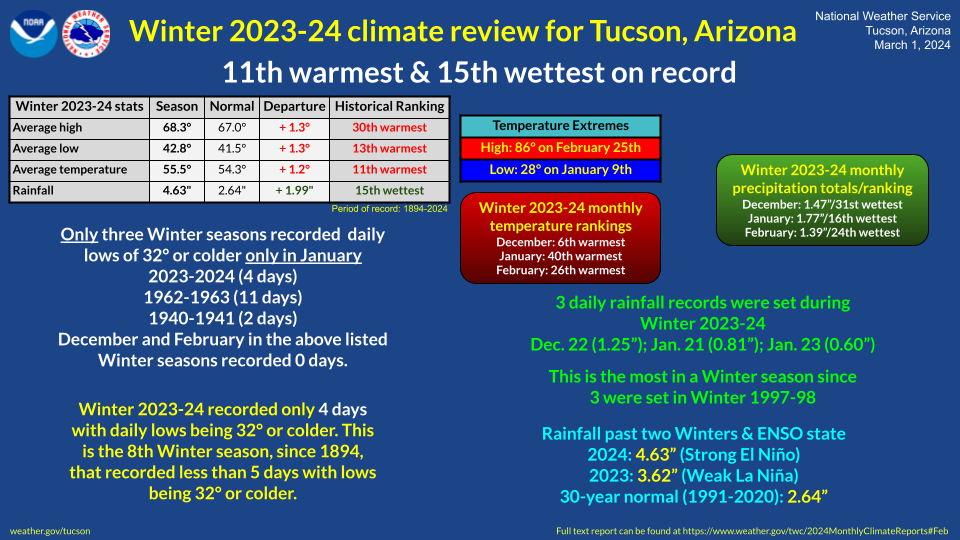
| 11th warmest and 15th wettest on record |
| |
|
A strong El Niño was forecast to peak during the 2023-24 Winter season. El Niño typically brings an increased chance of wetter than normal conditions during the Winter months, December, January, and February. However, there was no model consensus to swing the chances of a wetter-than-normal winter for Tucson. Based on that assessment the temperature and precipitation outlook for Tucson, issued on November 17th by the Climate Prediction Center, called for the following:
- a 33% chance that the seasonal mean temperatures will be below normal
- a 33% chance that the seasonal mean temperatures will be above normal
- a 33% chance that the seasonal total precipitation will be below normal
- a 33% chance that the seasonal total precipitation will be above normal
|
| |
|
There were several active periods this past winter that helped shape the season. Those active periods were 1) several days before Christmas; 2) mid-January; and 3) the first 10 days of February. The numerous winter storms that moved across the area brought much-needed precipitation in the form of valley rain and mountain snow. This helped improve drought conditions across the metro area from severe classification at the start of winter to moderate classification at the end of winter.
|
| |
|
The seasonal average temperature of 55.5° is 1.2° above normal and goes into the record books as the 11th warmest on record, tied with Winter 1995-96 & Winter 2008-09. Temperature extremes ranged from a high of 86° on February 25th to a low of 28° on January 9th. Four days recorded freezing low temperatures at the airport, which all occurred in January. This is the third Winter on record in which all of the 32° or colder low-temperature days occurred in January. The other Winters were 1940-41 and 1962-63. This is also the 8th Winter season on record that recorded less than 5 days with lows of 32° or colder.
|
| |
|
Precipitation across the metro area, using several sources like rainlog.org, the Pima County Regional Flood Control District gages, and CoCoRaHS, ranged widely from 3.25" to 6.00" with isolated spots up to 8". The Tucson International Airport, which is the official recording location in Tucson, recorded 4.63" which is nearly two inches above normal and ranks as the 15th wettest Winter season on record. The airport set three daily rainfall records (1.25" on December 22nd; 0.81" on January 21st and 0.60" on January 23rd). The last Winter season to record three or more daily rainfall records was Winter 1997-98 (3).
|
| |
| Winter 2023-2024 stats |
Season
|
Normal
|
Departure
|
| Average high temperature |
68.3°
|
67.0°
|
+ 1.3°
|
| Average low temperature |
42.8°
|
41.5°
|
+ 1.3°
|
| Average temperature |
55.5°
|
54.3°
|
+ 1.2°
|
| Rainfall |
4.63"
|
2.64"
|
+ 1.99"
|
| # of days with lows 32° or colder |
4
|
10
|
- 6
|
|
Period of record: 131 years (1894-2024)
|
|
| |
|
| |
| 2024 |
|
The yearly mean temperature of 54.9° which is normal and ranks as the 27th warmest January/February period on record.
Precipitation across the metro area during the first two months of the year has ranged widely from 2.25" to 4.50" with isolated spots up to 5.50". The Tucson International Airport, the official recording location in Tucson, has recorded 3.16" which is almost an inch and a half above normal and ranks as the 14th wettest January/February period on record. The water year rainfall (October 1 to February 29) total of 5.10" ranks as the 35th wettest first five months of the water year on record.
|
| |
|
| |
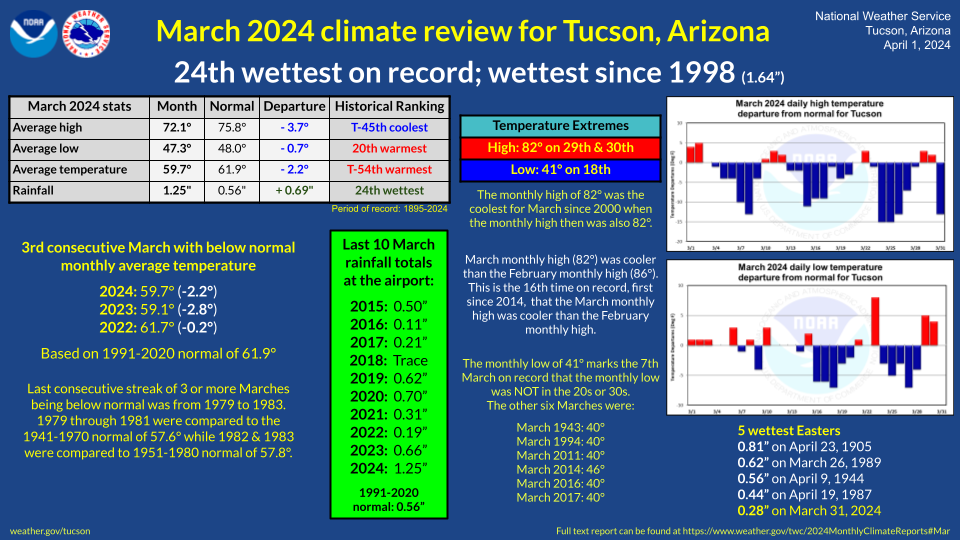
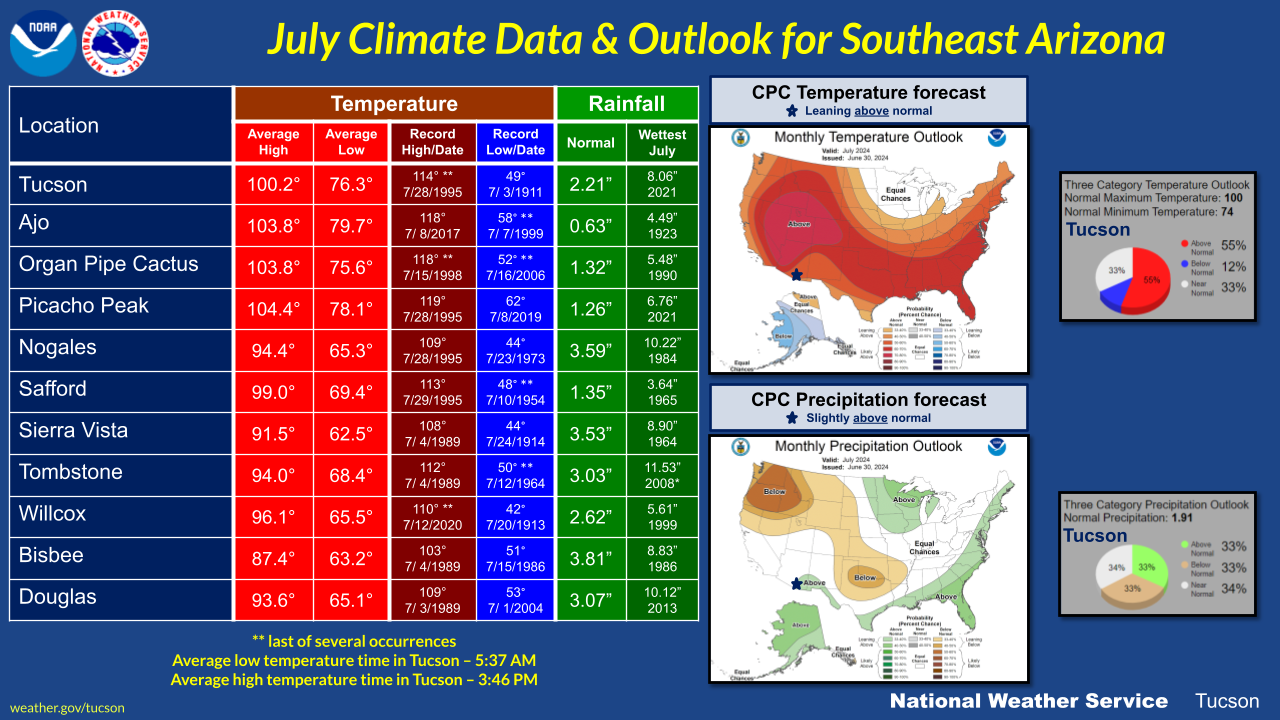
| Looking ahead into March |
|
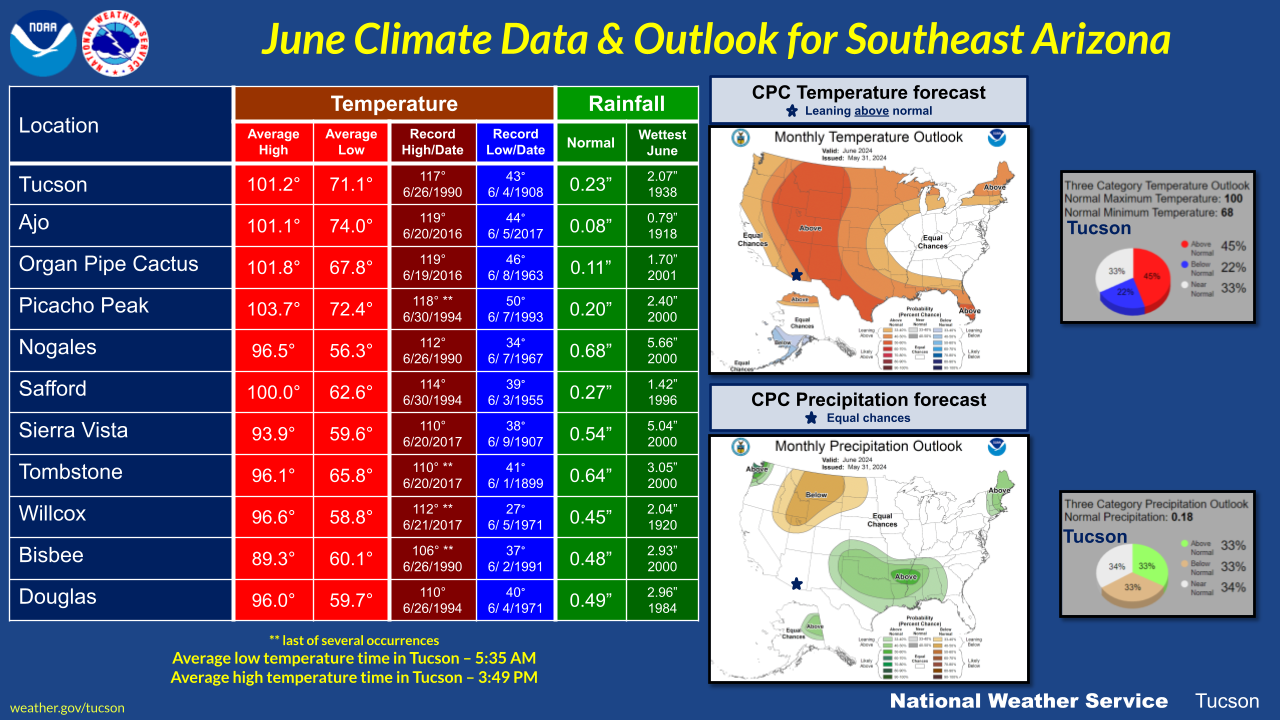
The March outlook from the Climate Prediction Center for Tucson favors below-normal monthly mean temperatures (45% below vs 22% above) and equal chances for either below, near, or above-normal total precipitation amounts.
|
| |
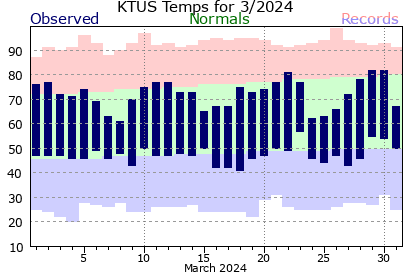
| Normal monthly high temperature |
75.8° |
| Normal monthly low temperature |
48.0° |
| Normal monthly temperature |
61.9° |
| Record high temperature |
99° on March 26, 1988 |
| Record low temperature |
20° on March 4, 1965 |
| Warmest March (avg.) |
67.9° in 2017 |
| Coldest March (avg.) |
51.5° in 1973 |
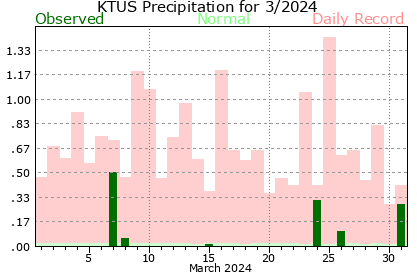
| Normal rainfall |
0.56" |
| Wettest March day |
1.42" on March 25, 1903 |
| Wettest March |
3.88" in 1905 |
| Driest March |
0.00" in 1895, 1928, 1933, 1956 & 1984 |
| Snowiest March |
6.0" in 1922 |
| Daily normals | Daily records |
|
|
| The number of daylight hours will increase from 11 hours 31 minutes 28 seconds on the 1st to 12 hours 30 minutes 51 seconds on the 31st, a gain of 59 minutes 23 seconds. |
| |
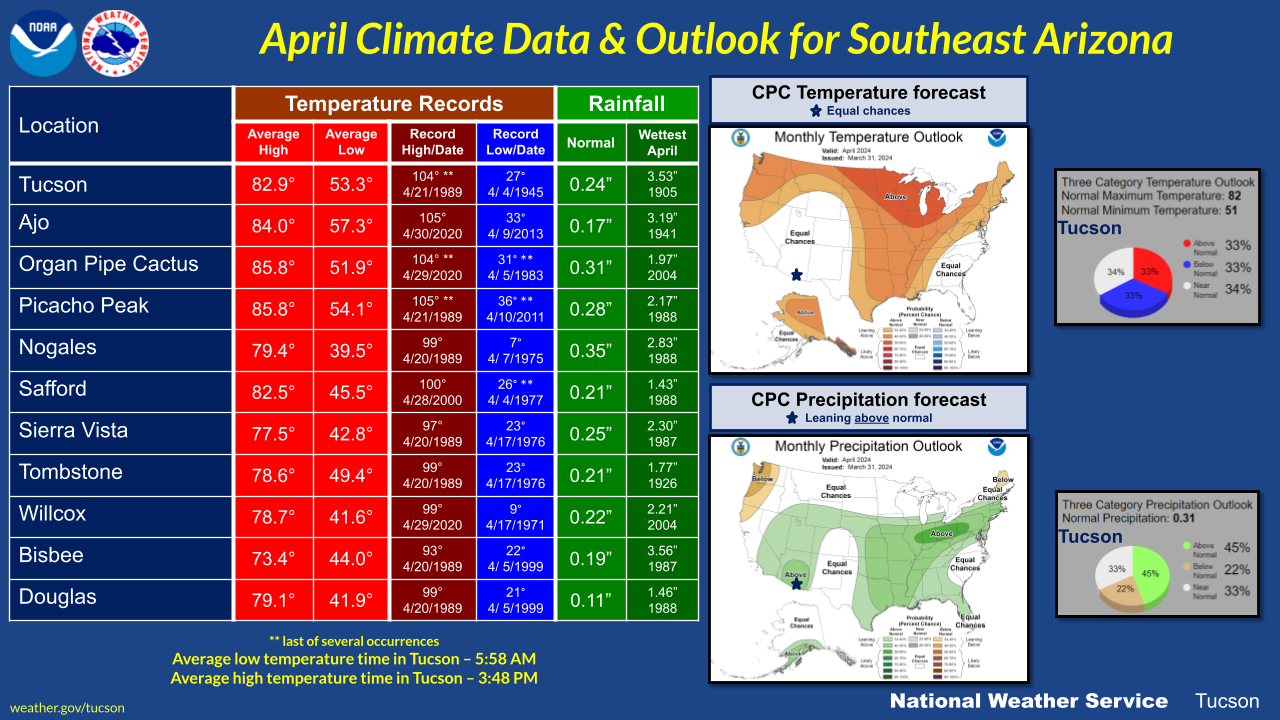
| Looking ahead into Spring |
|
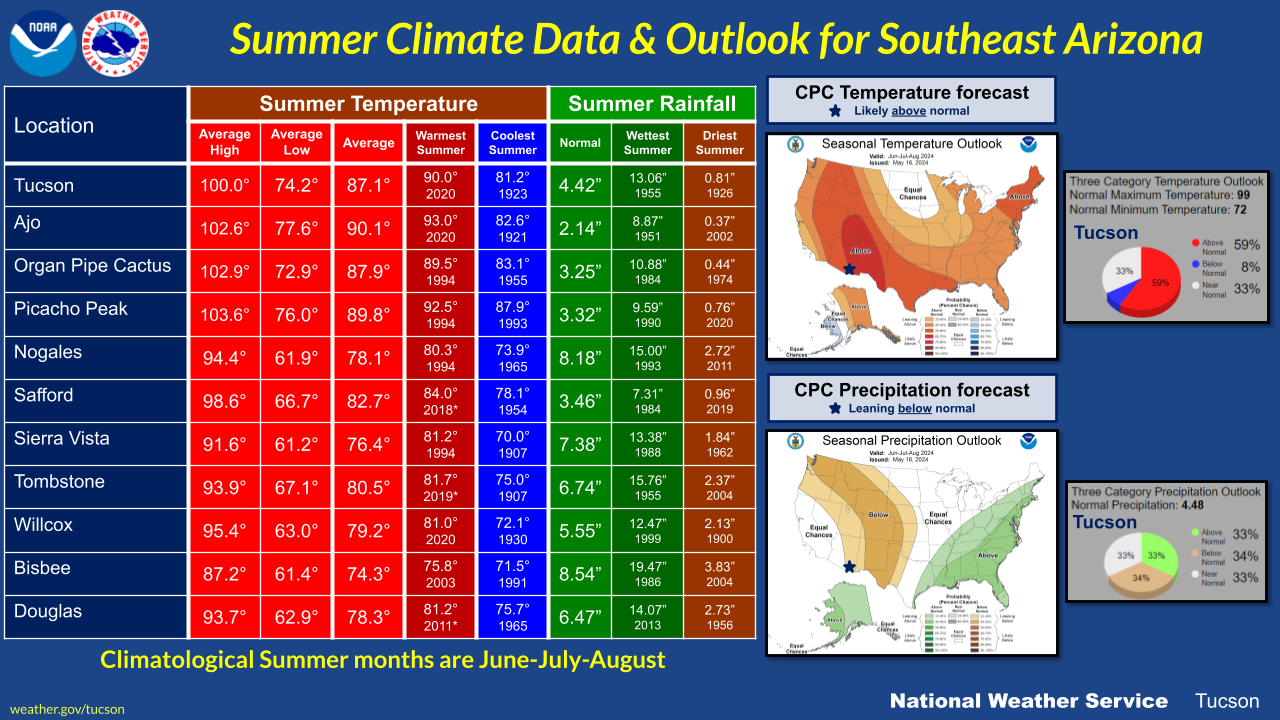
The Spring season outlook from the Climate Prediction Center for Tucson slightly favors below-normal total seasonal precipitation amounts (34% below vs 33% above) and equal chances for either below, near, or above-normal seasonal mean temperatures.
|
| |
| Normal seasonal high temperature |
83.5° |
| Normal seasonal low temperature |
54.3° |
| Normal seasonal temperature |
68.9° |
| Warmest Spring (avg.) |
72.1° in 1989 |
| Coldest Spring (avg.) |
59.0° in 1905 |
| Normal Spring rainfall |
1.00" |
| Wettest Spring |
7.43" in 1905 |
| Driest Spring |
Trace in 2018 |
| |
|
|
| The vernal equinox, otherwise known as the beginning of spring, will occur on March 19th at 8:06 PM when the sun crosses into the northern hemisphere. |
| |
| Glueck |


