Note: Tabs with a * will open a new browser/browser tab to another NWS page.
Where to find forecasts of Heat Index, also known as Apparent Temperature.
For this example, National Weather Service at Binghamton, NY will be used.
The example image below shows how to get a forecast. Click either on the map nearest your location, or enter a location, City, State or Zipcode into the box in the upper left of the web page.
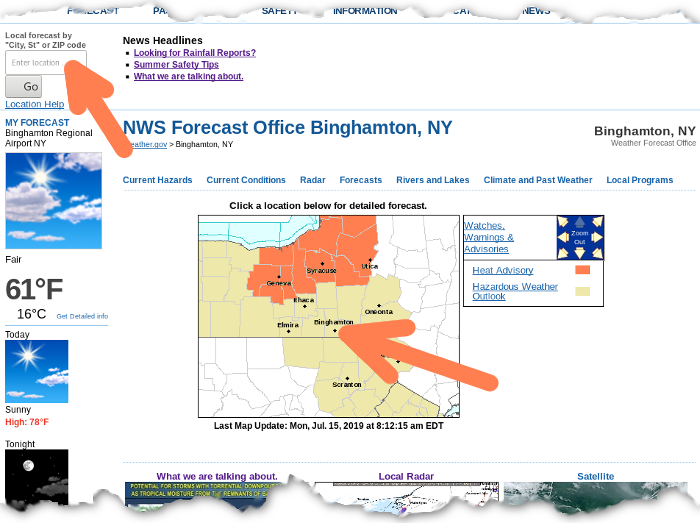
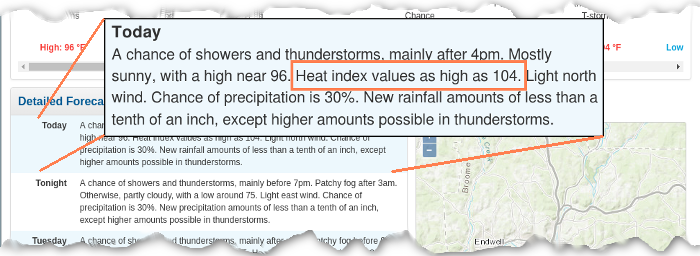
Once either of these steps are complete, a new page will appear with the forecast, this is also called the "point and click" forecast. The page is long so scroll down to the text part of the forecast. In this example, the forecast is for heat index values as high as 104 degrees F.
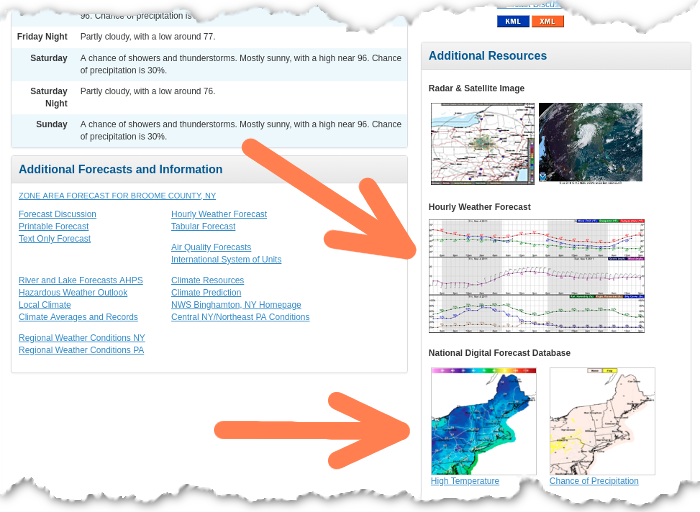
Farther down the page are links for additional forecast displays, as shown by the orange arrows below. One is an hourly graph and the other is display on a map.
Clicking on the Hourly Weather Graph image will produce a graph based forecast, or meteogram. Note that the orange arrows in the image below. The arrows show the settings and where to look for the Heat Index forecast on this type of web page. In this example, the light brown line shows the Heat Index forecast.
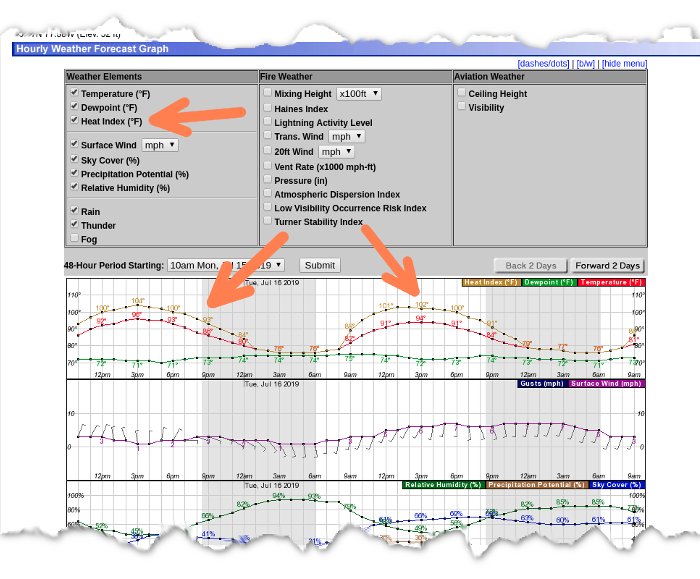
The Hourly Weather Graph can also display the following forecast weather elements:
| Public Forecast Weather Elements | Fire Weather Forecast Elements |
|
|
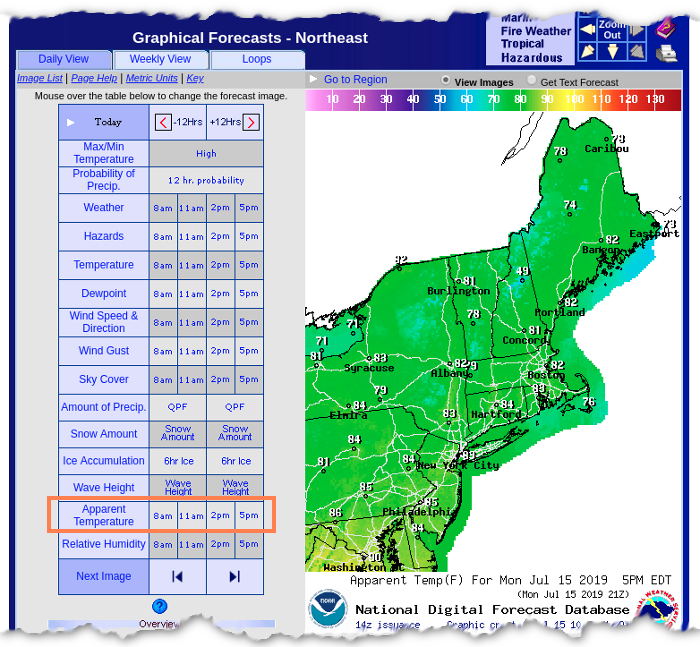
Lastly, back on the "point and click" forecast page there was a link to the National Digital Forecast Database. This is where graphical forecasts can be found. These forecasts are displayed on a map for the entire country, parts of the country, or for local National Weather Service forecast areas.
The example image below shows the graphical forecast for the parts of the northeast United States. Clicking on the map will zoom it in a bit more. In this type of page you can use your mouse to move over the forecast element times to change the image displayed.
Note the orange highlighted area. It is a forecast for Apparent Temperature. Apparent Temperature during the summer time is the same as Heat Index. During the winter it would be the same as Wind Chill.
This graphical forecast page is planned to be replaced by the map viewer now operationally available at digital.weather.gov.
Give it a try for your location, and if you have any questions, please either send an email to the webmaster or post a question on Facebook or Twitter.
The following criteria are for central New York and northeast Pennsylvania.
|
Heat Advisories |
Criteria for a Heat Advisory in Pennsylvania is a heat index of 100-104 °F and in New York 95-104 °F. The heat index has to remain at or above criteria for a minimum of 2 hours, only in New York. Pennsylvania does not have time requirement starting after June 12, 2023. Heat advisories are issued by county when any location within that county is expected to reach criteria. For example: If you expected the heat index to reach 95 °F in the city of Elmira, a heat advisory would be issued for that county.
A heat advisory means that people can be affected by heat if precautions are not taken. A quick study in the Corning area from the 2005 summer showed that early in the summer, emergency room visits increased when the heat index surpassed 95°F. The issuance of a heat advisory is important to raise public awareness that these precautions need to be taken. Heat advisories are also used to trigger other actions and regulations such as no evictions, no turning off of power, changing outdoor work requirements, etc. |
|
Excessive Heat Warnings |
Criteria for an Excessive Heat Warning is a heat index of 105 °F or greater (lasting for 2 hours or more in New York; no duration requirement in Pennsylvania zones). Excessive Heat Warnings are issued by county when any location within that county is expected to reach criteria. For example: If you expected the heat index to reach 105°F in the city of Elmira, an Excessive Heat Warning would be issued for that zone.
A heat warning means that some people can be seriously affected by heat if precautions are not taken. Studies in Canada, Europe, and the U.S. have indicated that mortality begins to increase exponentially as the heat increases or stays above a heat index of 104°F. Note: This threshold will be a rare event in our CWA. Even the warm summer of 2005, would not have produced a heat warning. In addition to raising public awareness, the issuance of a heat warning will alert hospitals and officials to take certain actions to prepare and respond to an increase in emergency calls, and activate programs to check on elderly and the home-bound. In some cases cooling centers can be open or designated and donation programs activated for fans and air conditioners. As in the case of an advisory, certain regulations may change such as turning off people's electricity, evictions, and outside work requirements. |
|
Excessive Heat Watches |
Issued when Heat Warning criteria is possible (50-79%) 1 to 2 days in advance.
|
Weather and Geographic Factors that Increase the Impact of Heat
Human Factors that increase the Impact of Heat
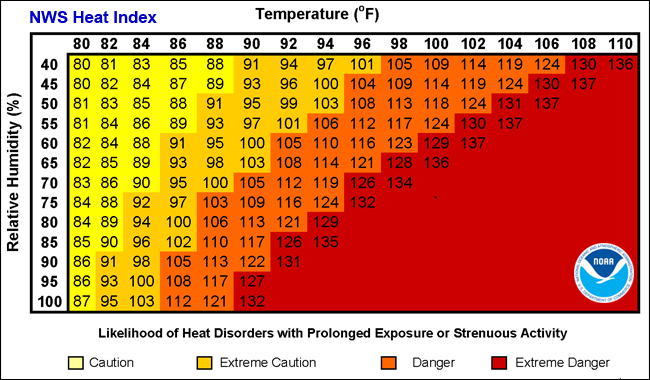
NOAA's heat alert procedures are based mainly on Heat Index Values. The Heat Index, sometimes referred to as the apparent temperature is given in degrees Fahrenheit. The Heat Index is a measure of how hot it really feels when relative humidity is factored in with the actual air temperature.
To find the Heat Index temperature, look at the Heat Index Chart below. As an example, if the air temperature is 96°F and the relative humidity is 65%, the heat index--how hot it feels--is 121°F. The National Weather Service will initiate alert procedures when the Heat Index is expected to exceed 105°-110°F (depending on local climate) for at least 2 consecutive days.
Additional Information

