Binghamton, NY
Weather Forecast Office
Storm Total Precipitation
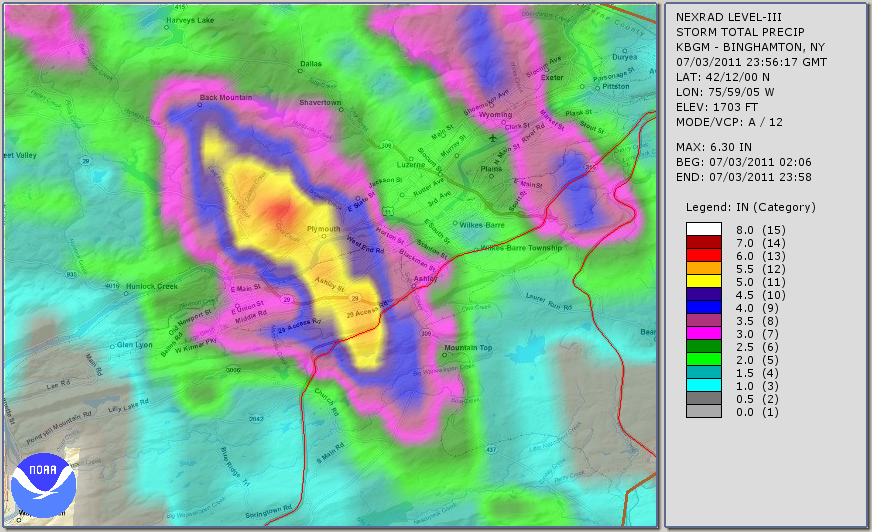
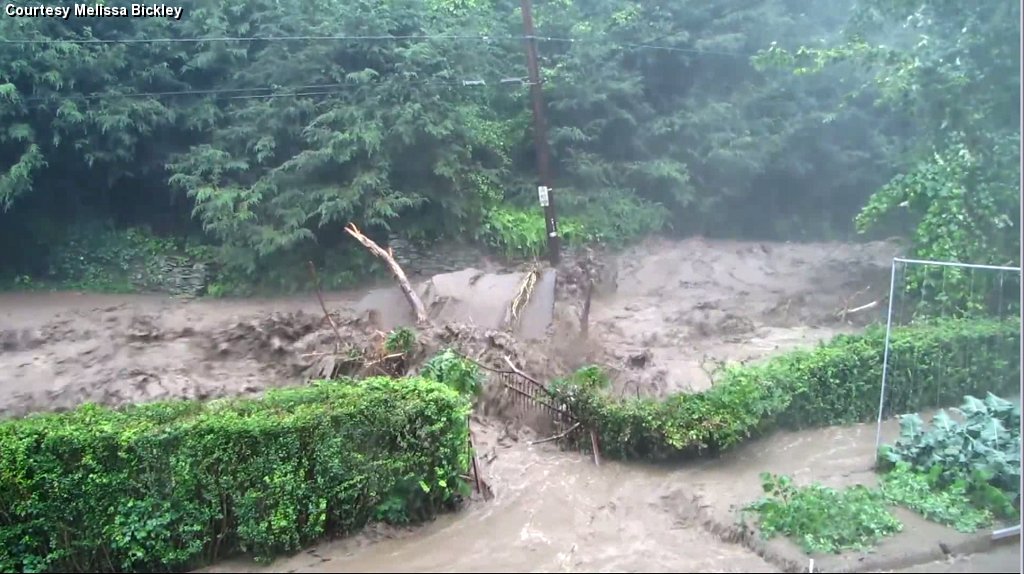
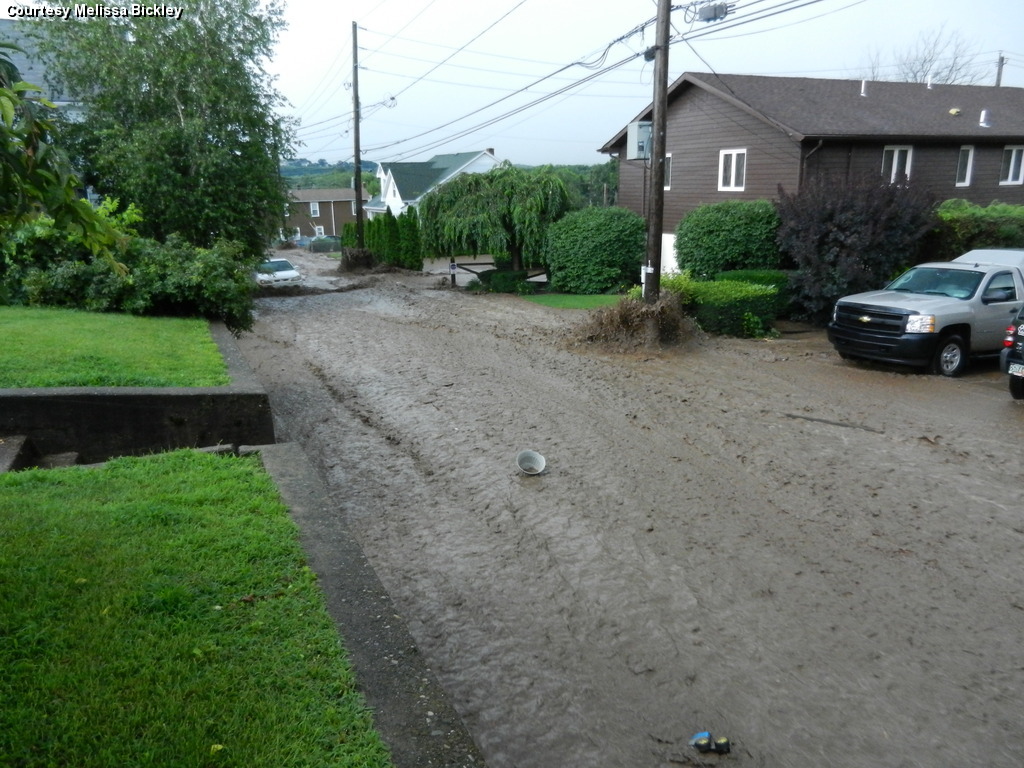
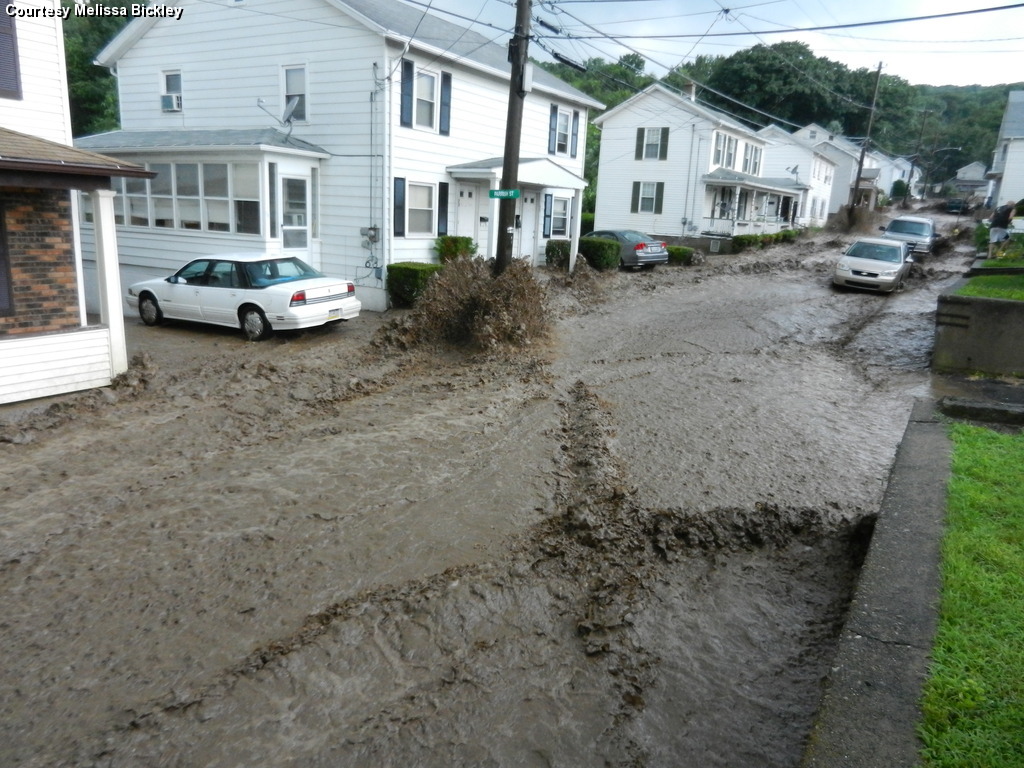
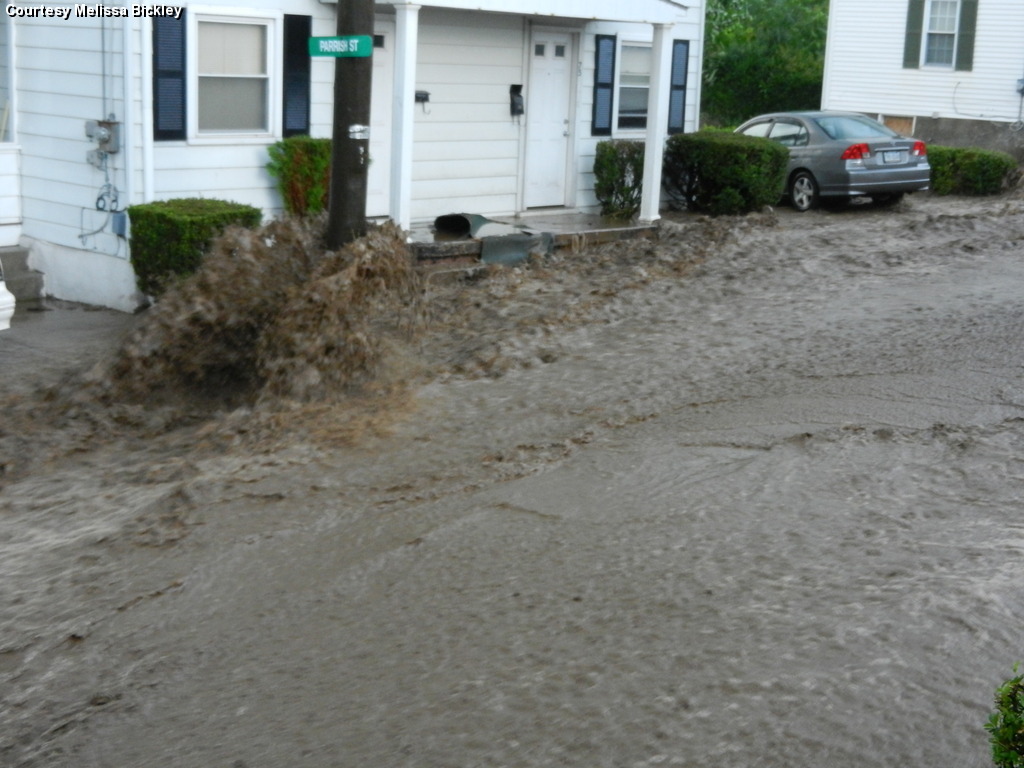
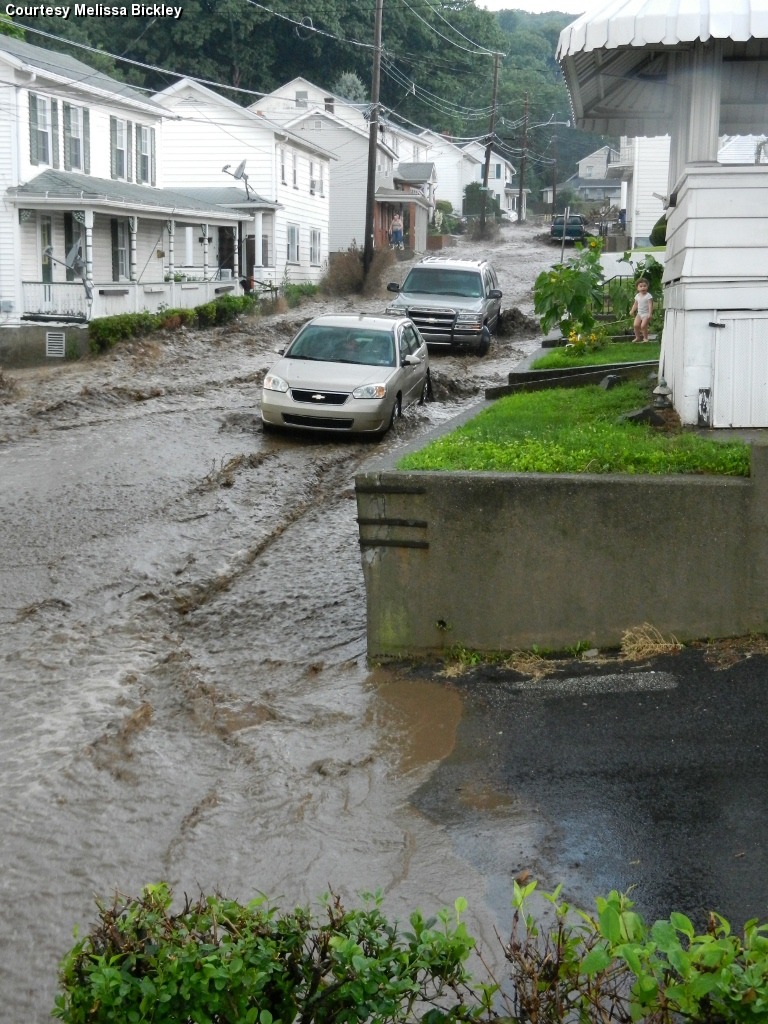
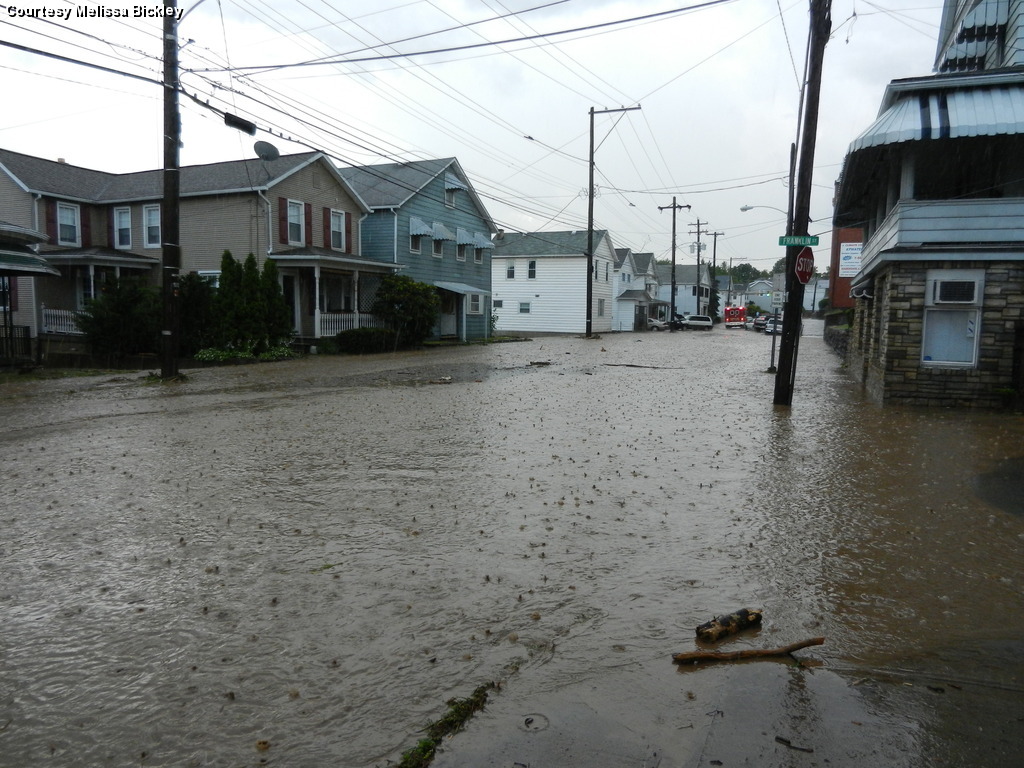
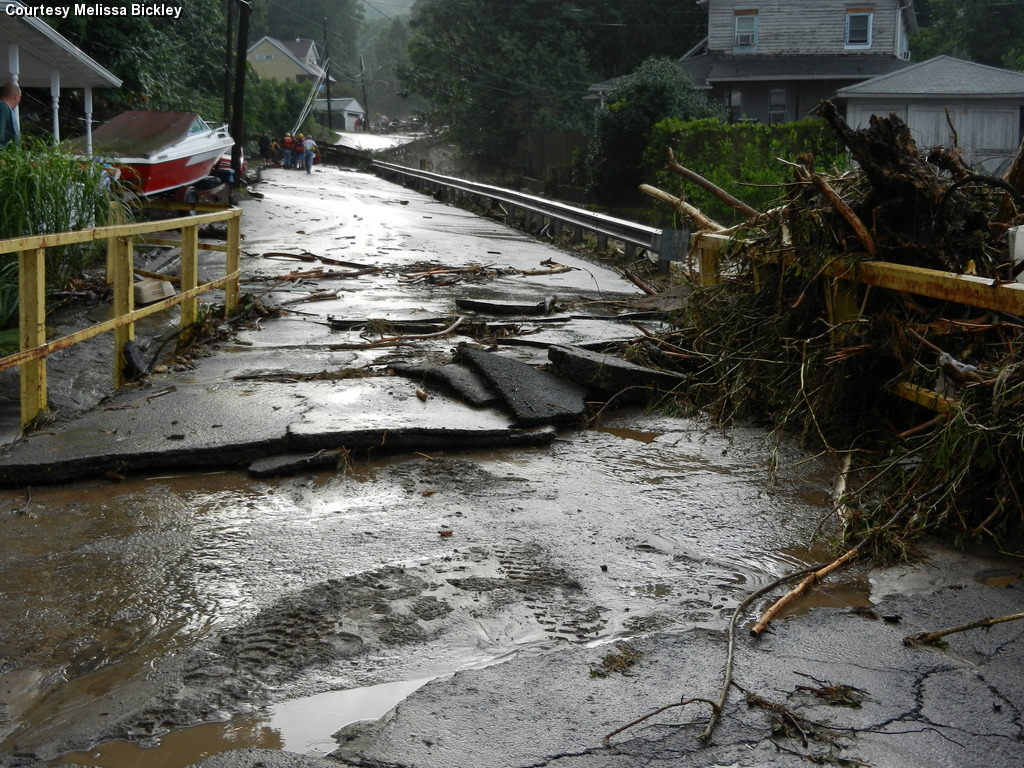
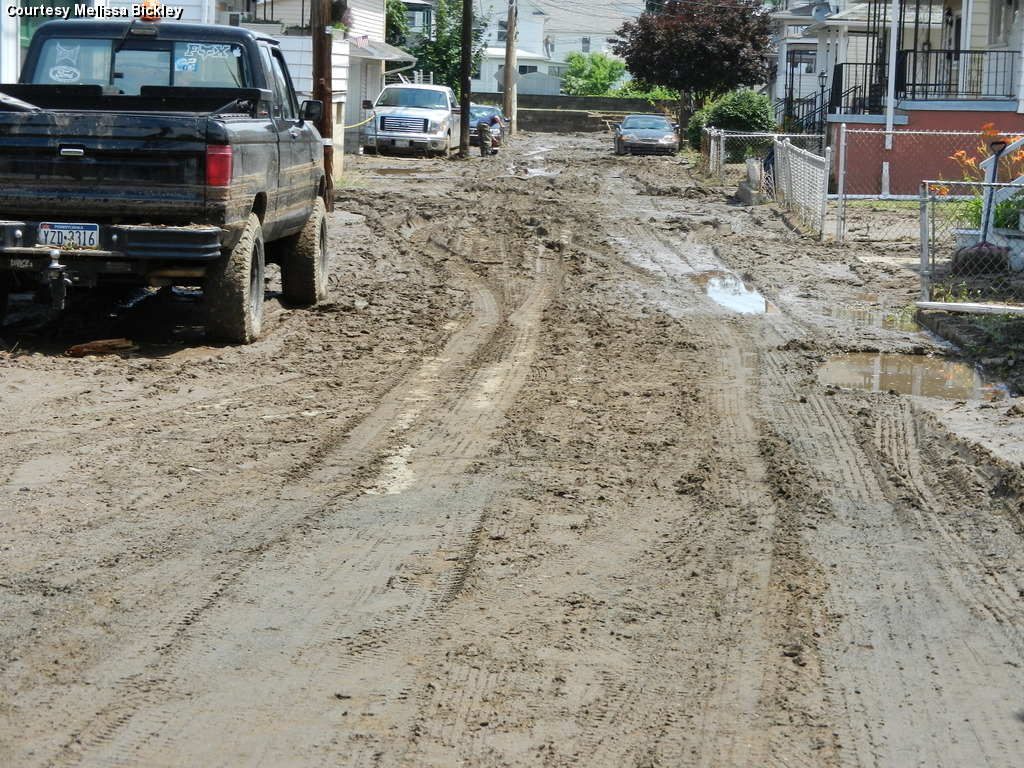
Storm Total Precipitation is the estimated accumulation since the precipitation began. The accumulation continues until there is no precipitation for one hour anywhere within the range of the radar. In this case the image below goes from 10:06 PM EDT (0206 UTC) July 2nd to 7:58 PM EDT (2358 UTC) July 3rd, 2011. A maximum value of 6.3 inches is shown near the Plymouth, PA area. More information about Storm Total Precipitation.
Below is a radar loop of the event start from 11:01 PM (0301 UTC) July 02 to 07:56 PM (2356 UTC) July 03, 2011.
 |
 |
 |
 |
 |
 |
 |
 |
 |
 |
 |
 |
 |
 |
 |
 |
 |
 |
 |
Current Hazards
Briefing
Drought
Fire Weather
Graphical Hazardous Weather Outlook
Hurricanes
Local Outlook
River Flooding
Space Weather
Thunderstorms
Winter
Current Conditions
Air Quality
Local Storm Reports
Observation (list)
Observations (Map)
More Surface Observations
Rainfall
Satellite
More Satellite
Upper Air
Radar
Local Enhanced Radar
Local Standard Radar (low bandwidth)
Regional/National Standard Radar (low bandwidth)
More Radar
Forecasts
Activity Planner
Aviation
Detailed View
Fire Weather
Forecaster's Discussion
Hourly View
Map View
Model Data
Space Weather
Text Products
User Defined Area Forecast
Rivers and Lakes
River Forecasts (Map)
River Observations (Map)
River Forecast Centers
River Forecasts (Text)
Ensemble River Guidance
Current Streamflow
Flood Inundation Maps
River Monitor
US Dept of Commerce
National Oceanic and Atmospheric Administration
National Weather Service
Binghamton, NY
32 Dawes Drive
Johnson City, NY 13790
(607) 729-1597
Comments? Questions? Please Contact Us.

