Jeffersonville Flash Flooding
That National Weather Service in Binghamton, NY conducted a storm survey for flash flooding on Monday August 3,rd 2009 in Sullivan county. The actual flash flooding occurred early in the morning of Thursday July 30th. More flash flooding occurred in the same area again Friday July 31st and to a lesser extent on Sunday August 2nd. An unofficial observer located in downtown Jeffersonville measured over 5 inches of rain by early Thursday morning. His gage had a total capacity of 5 inches, so more than 5 inches could have fallen. This same observer measured 3 inches of rain again Friday, in less than 2 hours time. On Sunday he measured another 2 inches, for a total of over 10 inches of rain in less than a week. The observer is a member of the local fire department.
The main area of focus was across the northern part of the county along county Route 52 from Jeffersonville to Youngsville. Another area of focus was just off Route 17 near Livingston Manor. The highest storm total rainfall fell on the night of Wednesday July 29th into the early morning of Thursday July 30th. The heavy rain caused rapid rises of the two small tributaries that run through Jeffersonville and into the east branch of Callicoon Creek. The main tributary is the Laundry Brook with an unnamed creek originating at a pond just east of Creamery Road. The excessive rainfall caused a rapid rise of the creek and eventual flooding of the island area of Jeffersonville. This includes Lovett Lane, Mill Street, and Silver Heights Road.
Downstream, two more unnamed creeks or brooks allowed additional discharge of water to flow toward the east branch of Callicoon Creek near Kohlertown. Both creeks originated from ponds north of the central school and east of Jeffersonville North Branch Road. The first creek over-topped Jeffersonville North Branch Road, causing extensive erosion along the east side of the road for about 0.8 of a mile toward county Route 52. The other unnamed creek which was located west of the one mentioned above, over-topped county Route 164 or Beechwood Road, before flowing into the east branch of Callicoon Creek. In the Kohlertown area, flooding in houses, mainly confined to basements along with a few businesses were reported. This was due to a combination of the two creeks mentioned above overflowing their banks on the way to the east branch of the Callicoon Creek along with the actual east branch of the Callicoon Creek running out of its banks.
In the Jeffersonville area, numerous roads were eroded along the sides due to flowing water. This includes but is not limited to, Jeffersonville North Branch Road, Callicoon Center Road and Dewitt Flats Road.
Youngsville Flash Flooding
Farther upstream along the east branch of the Callicoon Creek, in Youngsville, the creek was reported to have overtopped its banks at the business of mowers and more inc. At around 1:30 AM EDT Thursday morning. Water entered the business and also knocked over numerous large trees in the creek behind it. Two large trees were pushed toward an adjacent house.
Livingston Manor Flash Flooding
Heavy rainfall across the northern part of the county caused the Little Beaverkill River in the town of Livingston out of its banks around 1:30 AM EDT Thursday morning. The water was 3 feet deep in one house, with a few other houses surrounded by water. Water covered portions of old liberty road. The peak flow of the water was just below the bottom of the bridge across the Little Beaverkill at the intersection of Old Liberty Road and Cross Road.
Our appreciation is extended to the Sullivan County Office of Emergency Management for their assistance on this storm survey. In addition to the storm survey, data was also collected on peak flows along the east branch of Callicoon Creek at Jeffersonville in order to work on a site specific distributed model to predict flooding in Jeffersonville. In the near future a case study will be put together of this flash flooding event.
Heden/Schaffner
| Multisensor Precipitation Estimates Maps click for a larger view |
||
|---|---|---|
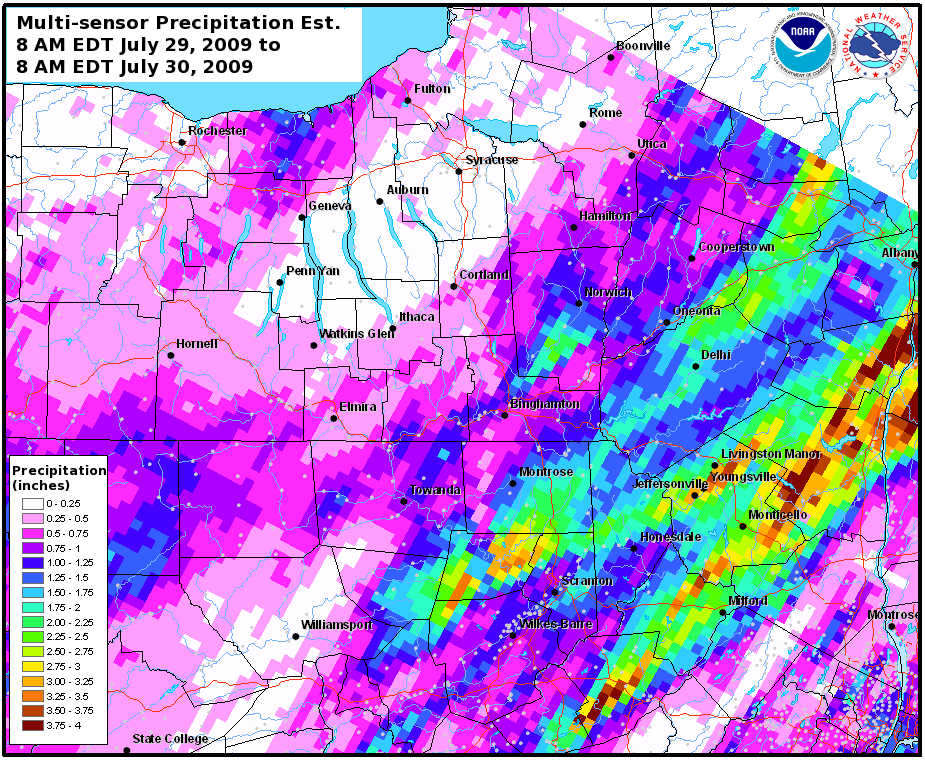 8 AM EDT July 29 to 8 AM EDT July 30, 2009. |
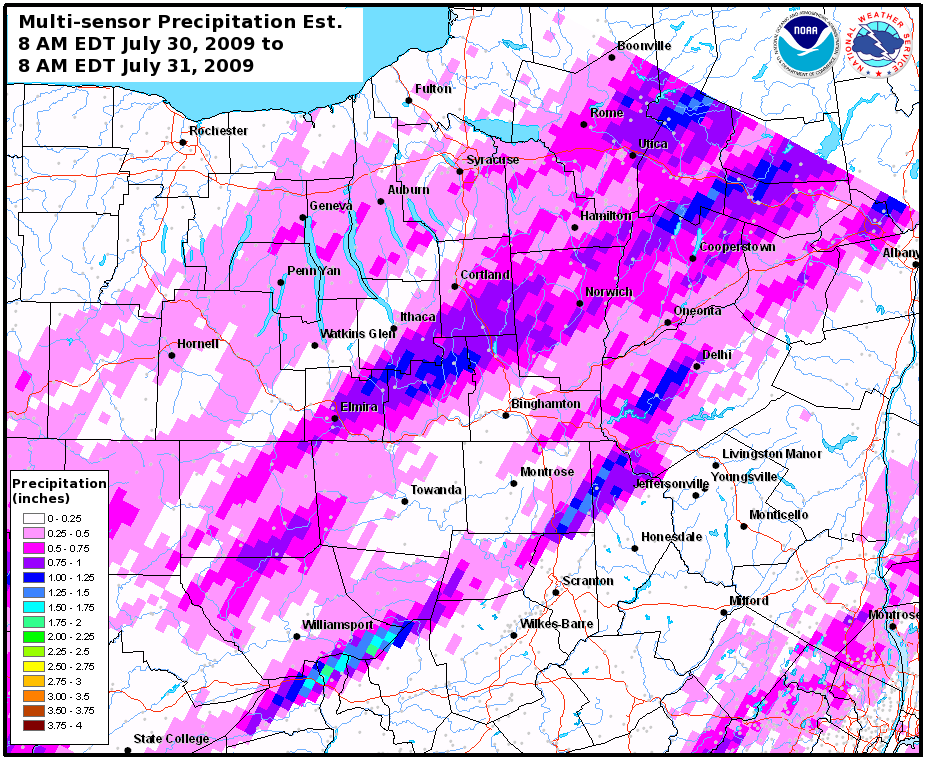 8 AM EDT July 30 to 8 AM EDT July 31, 2009. |
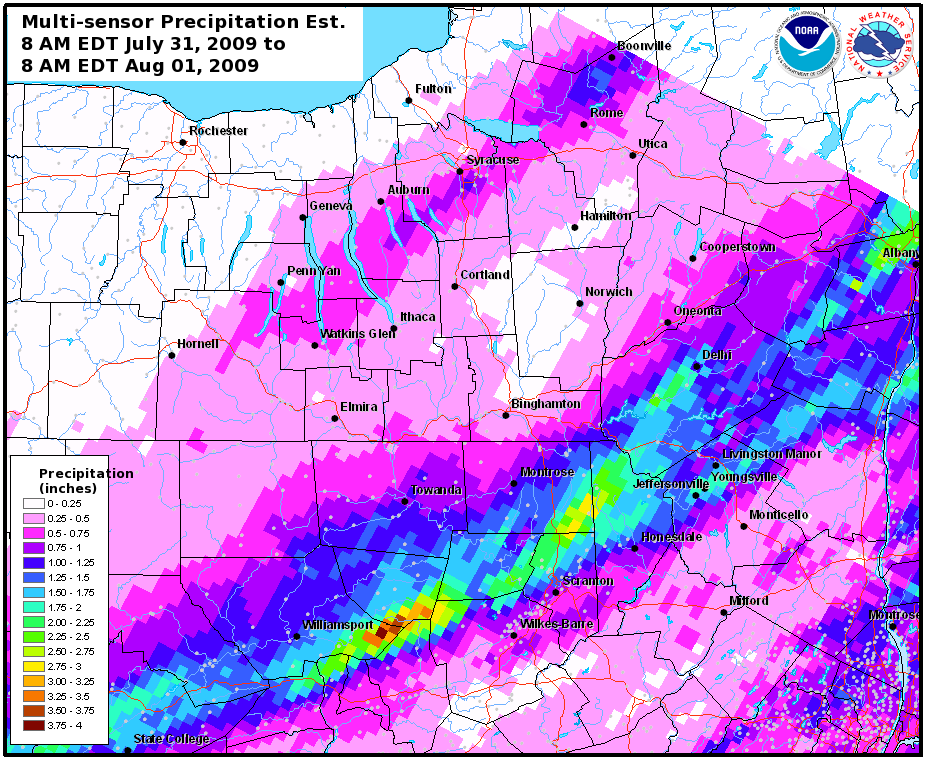 8 AM EDT July 31 to 8 AM EDT August 01, 2009. |
 8 AM EDT August 01 to 8 AM EDT August 02, 2009. |
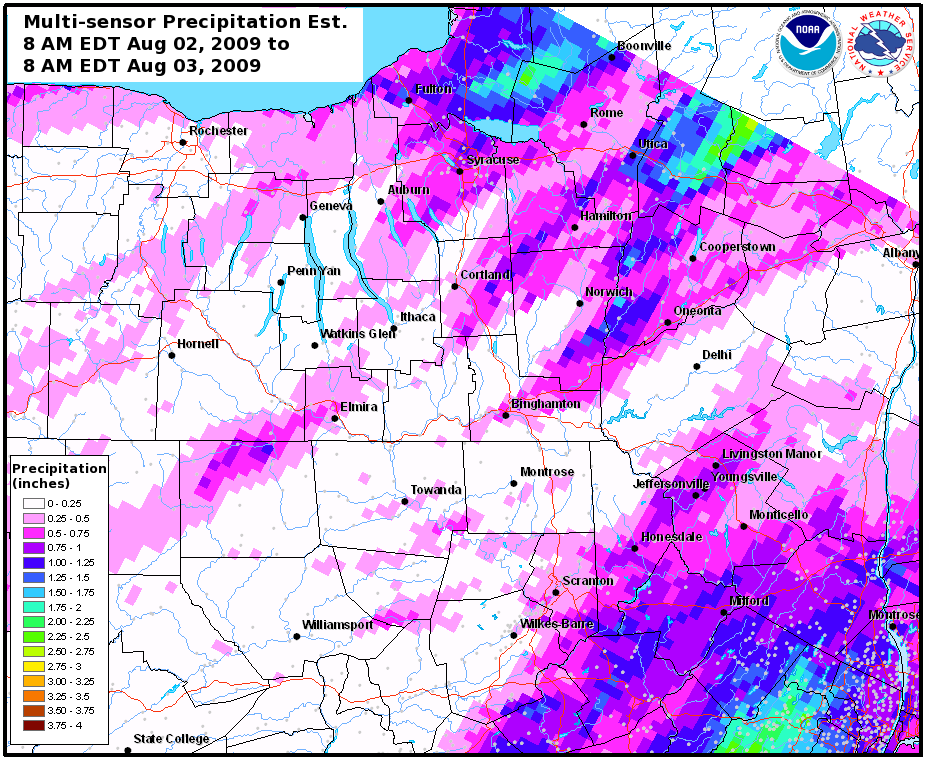 8 AM EDT August 02 to 8 AM EDT August 03, 2009. |
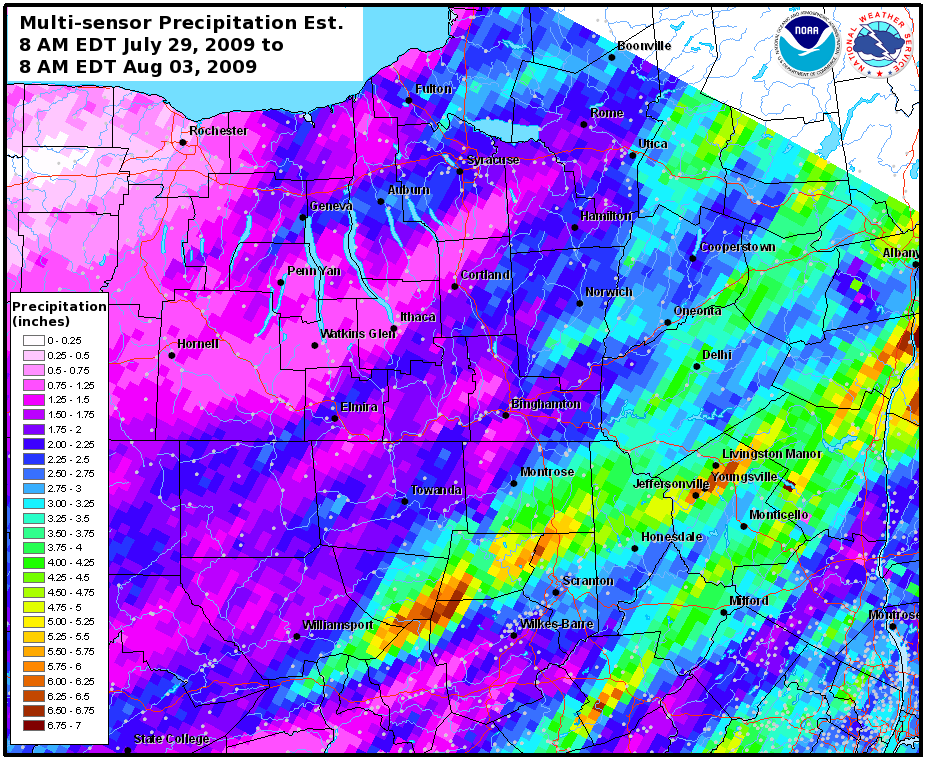 5 Day Total 8 AM EDT July 29 to 8 AM EDT August 03, 2009. |
|
Definition:
The MPE graphic shown in this section are Multisensor Precipitation Estimates, otherwise known as MPE data. The data used to produce this graphic is a combination of radar and precipitation gages. When using MPE data, it is important to remember it is vulnerable to the same inaccuracies that can be caused by either radar or precipitation gages. For radar, problems would be: freezing or frozen precipitation, low topped convection, bright banding, the reflectivity/rainfall relationship in use, calibration of the radar, radar location and elevation, range degradation, and the radar's effective coverage. For precipitation gages, problems come from freezing precipitation, windy conditions, gage siting, undermeasurement by tipping bucket gages in high intensity rainfall, and gage maintenance. |
||
Move you mouse over the image or click on the image to start a loop.
Animation below is from 8:38 AM on July 29, 2009 to 4:38 AM EDT July 30, 2009
Animation below is from 9:08 PM on July 30, 2009 to 6:08 PM EDT July 31, 2009
Animation below is from 12:08 AM August 02, 2009 to 5:08 PM EDT August 02, 2009