Binghamton, NY
Weather Forecast Office
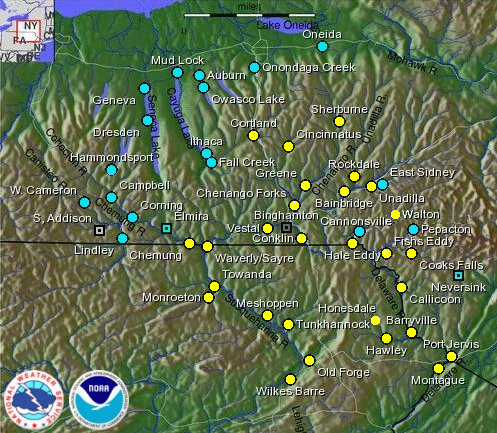
This page contains links to river data for some of the river gages across the NWS Binghamton county warning area. The NWS Binghamton office has warning responsiblity for the locations mark with a light blue or yellow circles. The data will include a hydrograph showing the river stage at that location before and after the flooding event.
The data shown here is a snapshot of what the river stage was during the flooding event.
What is a hydrograph? This type of graph shows how the river level changes over time at a specific location. River level or stage is in feet and on the left side of the hydrograph.
Please note the time and date of the data on each of these pages. Times on the graphic are in Z time in a military or 24 hour time format. for more information, see the bottom of this page.
Each hydrograph has a horizontal line that shows the following,
To view past data for selected sites, click on the yellow circles.
This is not real time information. To view real time river data and forecasts, please visit the National Water Prediction Service page.
What is Greenwich Mean Time (GMT)?
GMT was established to aid worldwide oceanic navigation and is based on the rotation of the Earth. It was not until the British railway system started using GMT in the mid 1800s that GMT was adopted "for land use". And it was not until the late 1800s that GMT was adopted universally. At this time, the 24 time zones were created along with the International Date Line.
So, you want to know how to convert GMT into your local time zone. Well, it goes like this:
During Daylight Savings Time, GMT is 4 hours ahead of Eastern Daylight Time (EDT). So if the time is 0800 GMT, it is 4:00 a.m. in New York City and Miami and 1:00 a.m. in Los Angeles. During Standard Time, GMT is 5 hours ahead of Eastern Standard Time (EST). So, 1000 GMT corresponds to 5:00 a.m. in New York City and Miami and 2:00 a.m. in Los Angeles.
Please note that GMT may be listed as Zulu (Z) or Coordinated Universal Time (UTC).
Current Hazards
Briefing
Drought
Fire Weather
Graphical Hazardous Weather Outlook
Hurricanes
Local Outlook
River Flooding
Space Weather
Thunderstorms
Winter
Current Conditions
Air Quality
Local Storm Reports
Observation (list)
Observations (Map)
More Surface Observations
Rainfall
Satellite
More Satellite
Upper Air
Radar
Local Enhanced Radar
Local Standard Radar (low bandwidth)
Regional/National Standard Radar (low bandwidth)
More Radar
Forecasts
Activity Planner
Aviation
Detailed View
Fire Weather
Forecaster's Discussion
Hourly View
Map View
Model Data
Space Weather
Text Products
User Defined Area Forecast
Rivers and Lakes
River Forecasts (Map)
River Observations (Map)
River Forecast Centers
River Forecasts (Text)
Ensemble River Guidance
Current Streamflow
Flood Inundation Maps
River Monitor
US Dept of Commerce
National Oceanic and Atmospheric Administration
National Weather Service
Binghamton, NY
32 Dawes Drive
Johnson City, NY 13790
(607) 729-1597
Comments? Questions? Please Contact Us.

