Below are the "Top 10" Heat Index values for Avoca/Scranton, PA, Binghamton, NY and Syracuse, NY. The period used is show in each table. Below the "blue line" in each table is an extension of the data to show where July 2019 ranked. Note that for Binghamton, NY the day of the 20 and 21 are not shown because the values were low.
KEY: HI = Heat Index, T = Air Temperature, Td = Dewpoint Temperature. All temperatures are in degrees Fahrenheit.
|
Avoca/Scranton, PA (AVP)
1949-2019
|
| Rank |
Date and
Time (EST) |
HI |
T |
Td |
| 01 |
07/15/1995 15:00 |
112.6 |
97 |
77 |
| 02 |
06/29/1959 16:00 |
108.5 |
94 |
77 |
| 03 |
07/04/1999 16:54 |
107.3 |
93 |
77 |
| 04 |
06/21/1953 15:00 |
106.0 |
97 |
72 |
| 05 |
06/26/1952 15:00 |
105.1 |
97 |
71 |
| 05 |
07/22/2011 15:54 |
105.1 |
97 |
71 |
| 07 |
06/17/1952 16:00 |
104.7 |
95 |
73 |
| 07 |
07/05/1999 15:54 |
104.7 |
95 |
73 |
| 09 |
07/14/1995 18:00 |
104.6 |
93 |
75 |
| 10 |
07/04/1949 13:00 |
104.4 |
94 |
74 |
| |
| 11 |
07/18/2012 12:54 |
104.0 |
97 |
70 |
| 12 |
06/20/1953 16:00 |
103.5 |
95 |
72 |
| 13 |
07/06/1999 16:54 |
103.3 |
94 |
73 |
| 13 |
08/13/2016 14:54 |
103.3 |
94 |
73 |
| 15 |
07/20/2019 17:54 |
103.2 |
93 |
74 |
| 16 |
08/01/2006 15:54 |
103.1 |
92 |
75 |
| 16 |
07/19/2019 15:54 |
103.1 |
92 |
75 |
| 18 |
07/21/2019 15:54 |
103.0 |
91 |
76 |
|
|
Binghamton, NY (BGM)
1952-2019
|
| Rank |
Date and
Time (EST) |
HI |
T |
Td |
| 01 |
07/14/1995 18:00 |
103.2 |
93 |
74 |
| 02 |
07/21/2011 16:53 |
102.2 |
93 |
73 |
| 03 |
08/14/1985 15:00 |
101.0 |
93 |
72 |
| 03 |
06/25/1952 16:00 |
99.1 |
93 |
70 |
| 05 |
09/06/1998 16:56 |
98.9 |
88 |
76 |
| 06 |
06/21/1953 17:00 |
98.3 |
93 |
69 |
| 06 |
07/15/1983 19:00 |
98.3 |
90 |
73 |
| 08 |
06/26/1952 17:00 |
97.8 |
92 |
70 |
| 09 |
09/02/1953 15:00 |
97.7 |
97 |
67 |
| 10 |
07/05/1999 11:56 |
97.6 |
87 |
76 |
| |
| 11 |
07/23/1952 17:00 |
97.2 |
90 |
72 |
| 12 |
08/01/2006 15:53 |
97.1 |
89 |
73 |
| 12 |
09/03/1953 17:00 |
97.1 |
94 |
66 |
| 14 |
07/19/1972 17:00 |
96.6 |
88 |
74 |
| 14 |
06/25/1997 14:56 |
96.6 |
85 |
78 |
| 16 |
08/15/1995 14:00 |
96.4 |
90 |
71 |
| 16 |
07/06/1999 15:56 |
96.4 |
90 |
71 |
| 18 |
06/20/1953 16:00 |
96.1 |
89 |
72 |
| 18 |
08/03/1988 16:00 |
96.1 |
89 |
72 |
| 18 |
07/04/1999 16:56 |
96.1 |
89 |
72 |
| 18 |
08/02/2006 13:53 |
96.1 |
89 |
72 |
| 22 |
09/04/1953 15:00 |
96.0 |
91 |
69 |
| 23 |
06/29/1959 14:00 |
95.7 |
88 |
73 |
| 23 |
07/18/1982 13:00 |
95.7 |
88 |
73 |
| 23 |
07/19/2019 15:53 |
95.7 |
88 |
73 |
|
|
Syracuse, NY (SYR)
1948-2019
|
| Rank |
Date and
Time (EST) |
HI |
T |
Td |
| 01 |
07/21/2011 16:54 |
112.3 |
99 |
75 |
| 02 |
08/01/2006 14:54 |
109.9 |
95 |
77 |
| 03 |
08/09/2001 14:54 |
109.8 |
99 |
73 |
| 04 |
07/20/1977 16:00 |
108.5 |
94 |
77 |
| 05 |
08/03/1988 15:00 |
108.4 |
95 |
76 |
| 06 |
08/28/1948 15:00 |
107.4 |
98 |
72 |
| 07 |
07/04/1990 16:00 |
106.0 |
97 |
72 |
| 08 |
07/18/1982 14:00 |
105.8 |
92 |
77 |
| 08 |
07/02/2002 13:54 |
105.8 |
92 |
77 |
| 08 |
08/09/1973 16:00 |
105.8 |
95 |
74 |
| |
| 08 |
07/16/1988 18:00 |
105.8 |
95 |
74 |
| 08 |
07/05/1999 15:54 |
105.8 |
93 |
76 |
| 13 |
07/02/2018 15:06 |
105.7 |
95 |
74 |
| 13 |
07/01/2018 16:54 |
105.7 |
94 |
75 |
| 15 |
07/22/2002 15:54 |
105.1 |
97 |
71 |
| 16 |
07/04/1999 16:54 |
104.6 |
90 |
78 |
| 16 |
07/06/1993 17:00 |
104.6 |
93 |
75 |
| 18 |
08/15/1995 15:00 |
104.4 |
94 |
74 |
| 19 |
07/12/1987 16:00 |
104.3 |
92 |
76 |
| 19 |
07/14/1995 17:00 |
104.3 |
92 |
76 |
| 19 |
08/07/2001 15:54 |
104.3 |
92 |
76 |
| 22 |
06/21/1953 13:00 |
104.0 |
97 |
70 |
| 23 |
08/25/1948 15:00 |
103.9 |
96 |
71 |
| 23 |
06/18/1957 17:00 |
103.9 |
96 |
71 |
| 25 |
07/29/1949 15:00 |
103.5 |
95 |
72 |
| 25 |
08/13/1988 15:00 |
103.5 |
95 |
72 |
| 27 |
07/19/2013 12:54 |
103.3 |
94 |
73 |
| 27 |
08/02/2006 11:54 |
103.3 |
89 |
78 |
| 27 |
08/01/1955 14:00 |
103.3 |
94 |
73 |
| 30 |
07/29/1988 16:00 |
103.2 |
93 |
74 |
| 31 |
07/04/1974 16:00 |
103.1 |
92 |
75 |
| 31 |
07/21/1980 16:00 |
103.1 |
92 |
75 |
| 31 |
07/05/1993 15:00 |
103.1 |
92 |
75 |
| 31 |
06/15/1981 16:00 |
103.1 |
91 |
76 |
| 31 |
06/30/2018 16:54 |
103.1 |
92 |
75 |
| 31 |
07/19/2019 14:54 |
103.1 |
92 |
75 |
| 31 |
07/20/2019 16:54 |
103.1 |
92 |
75 |
|
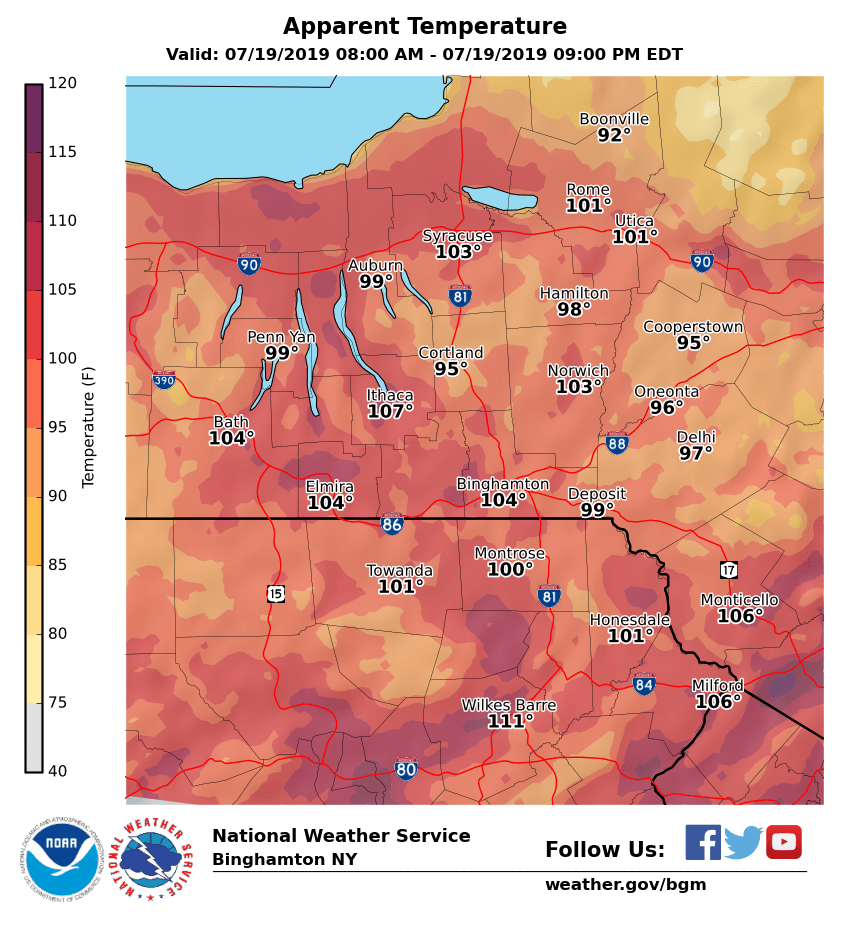
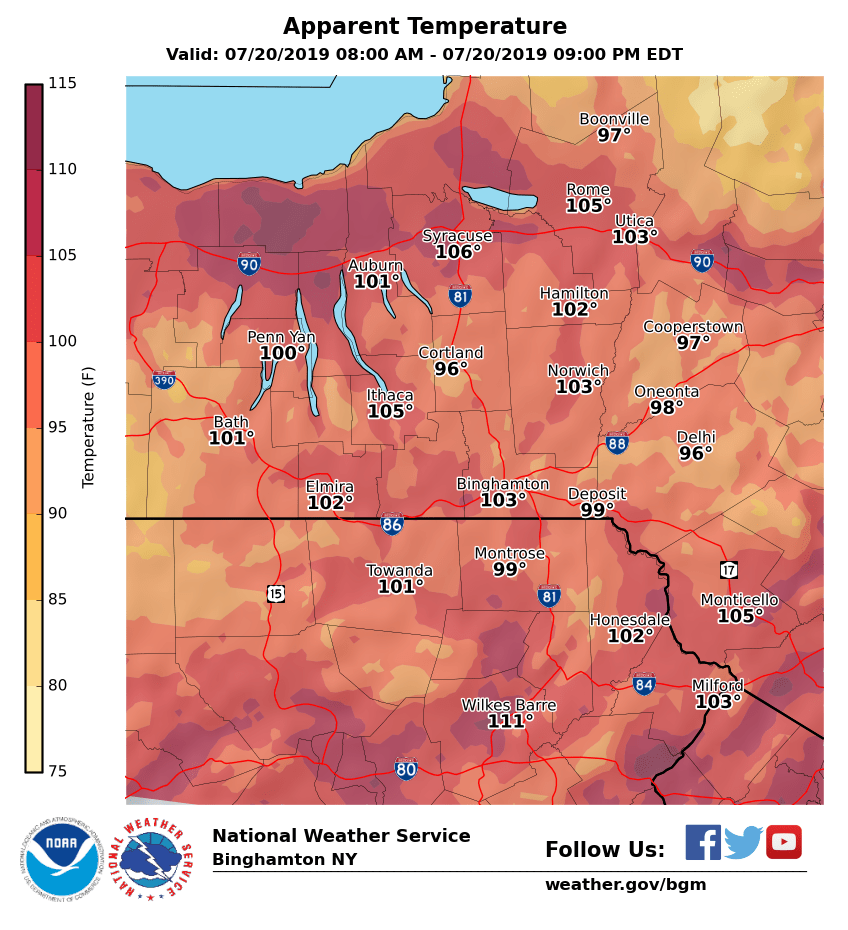
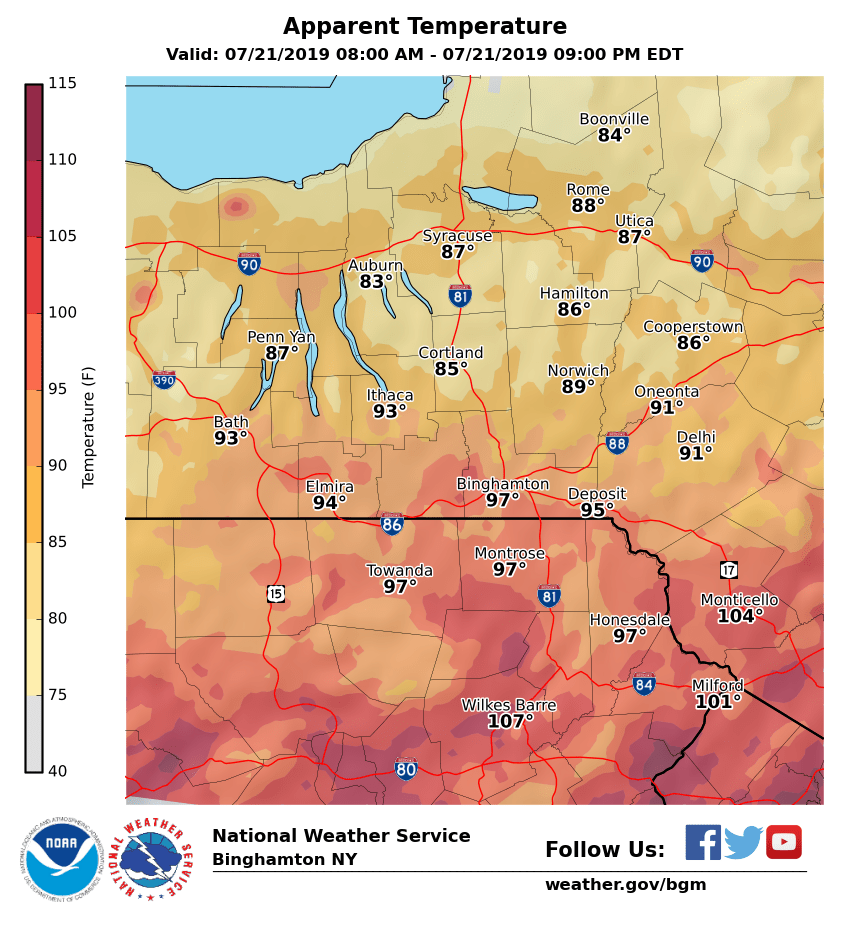
Below are maps for July 19, 20, and 21 2019.
Click on each for a larger view.