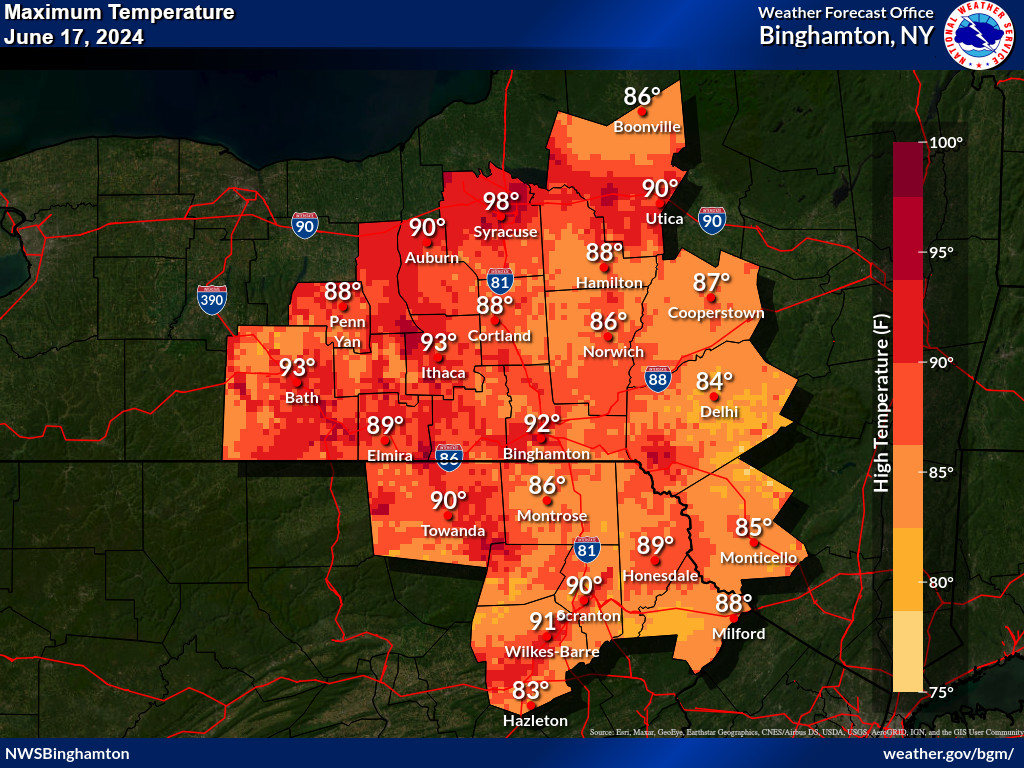
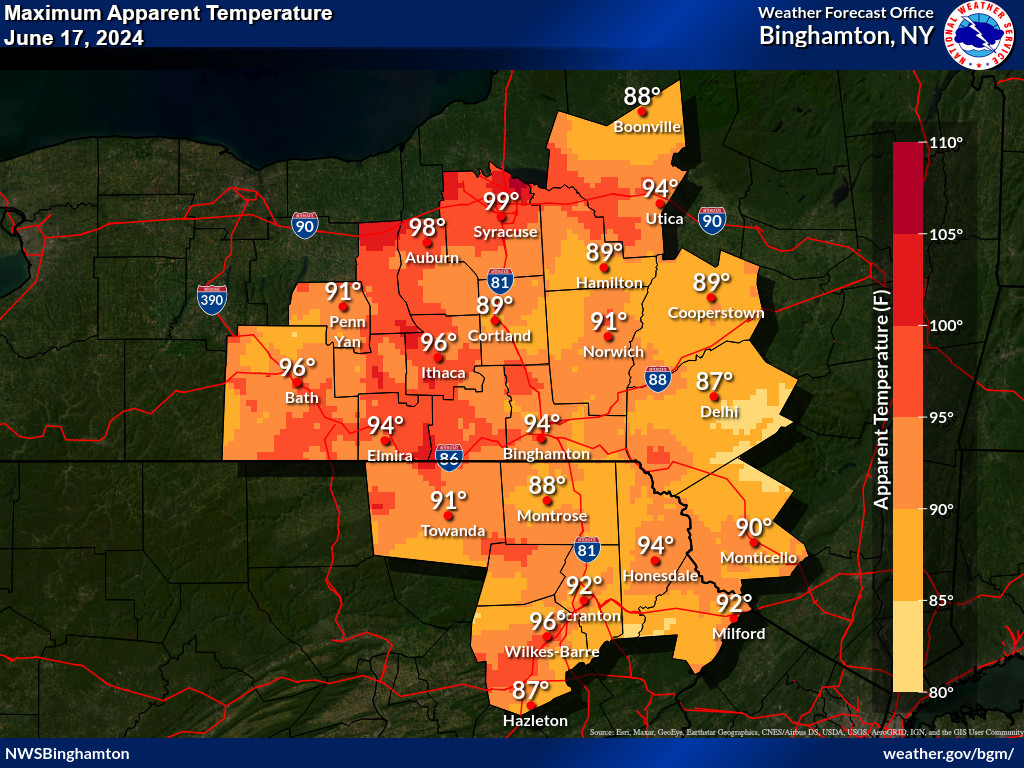
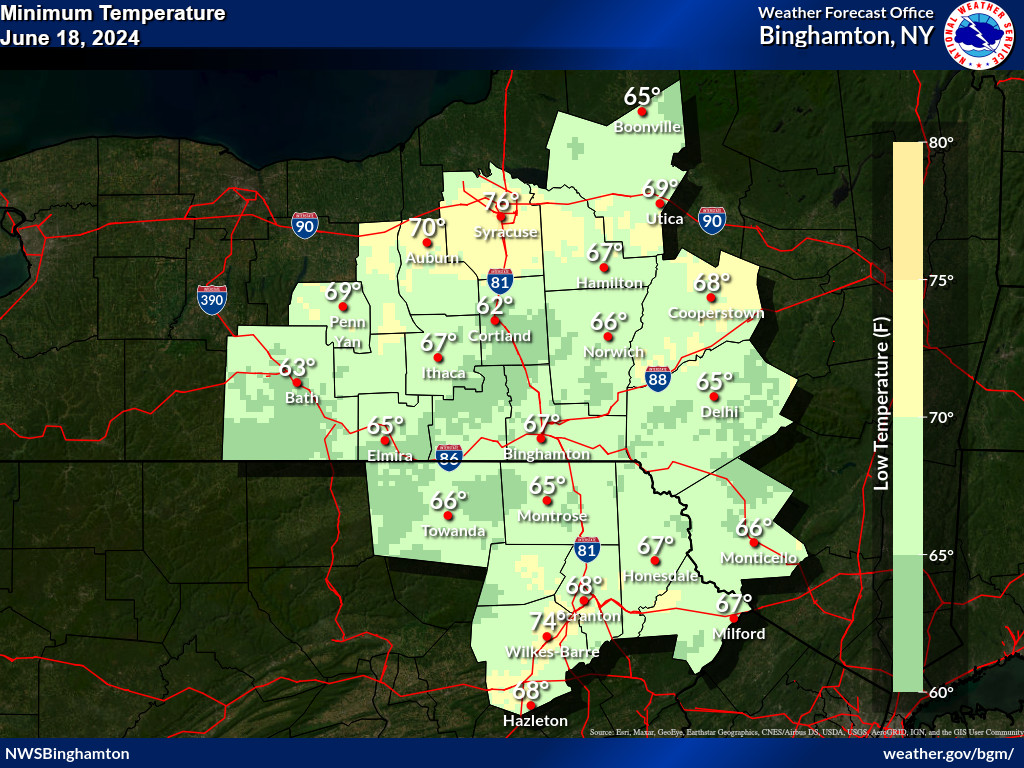
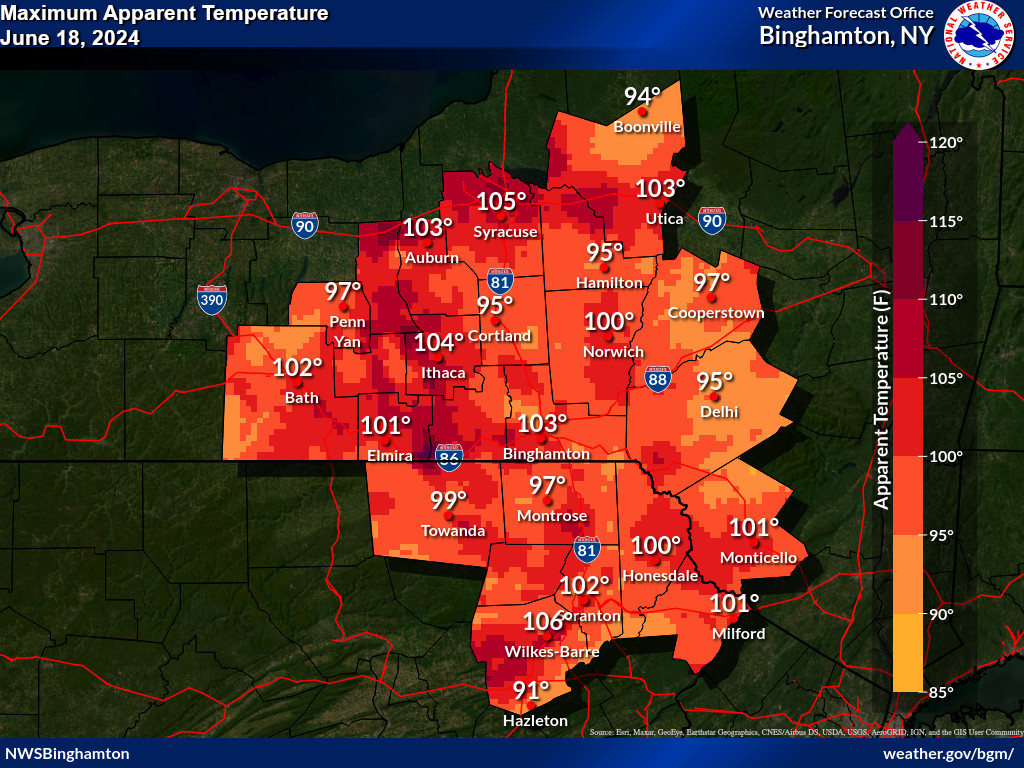
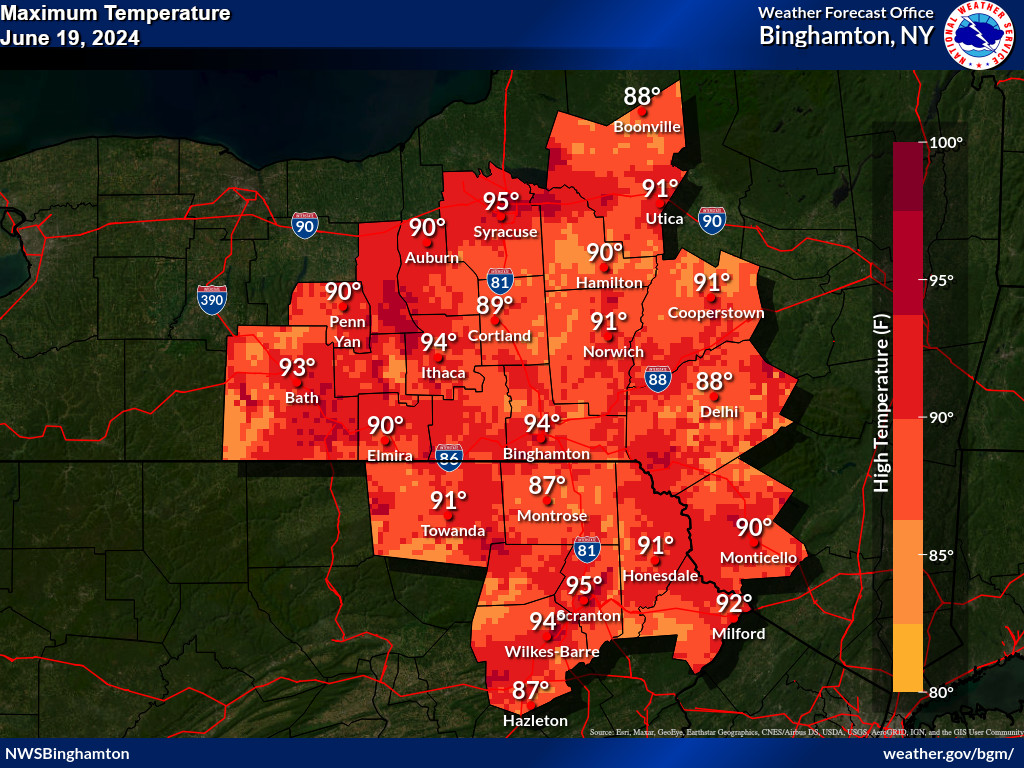
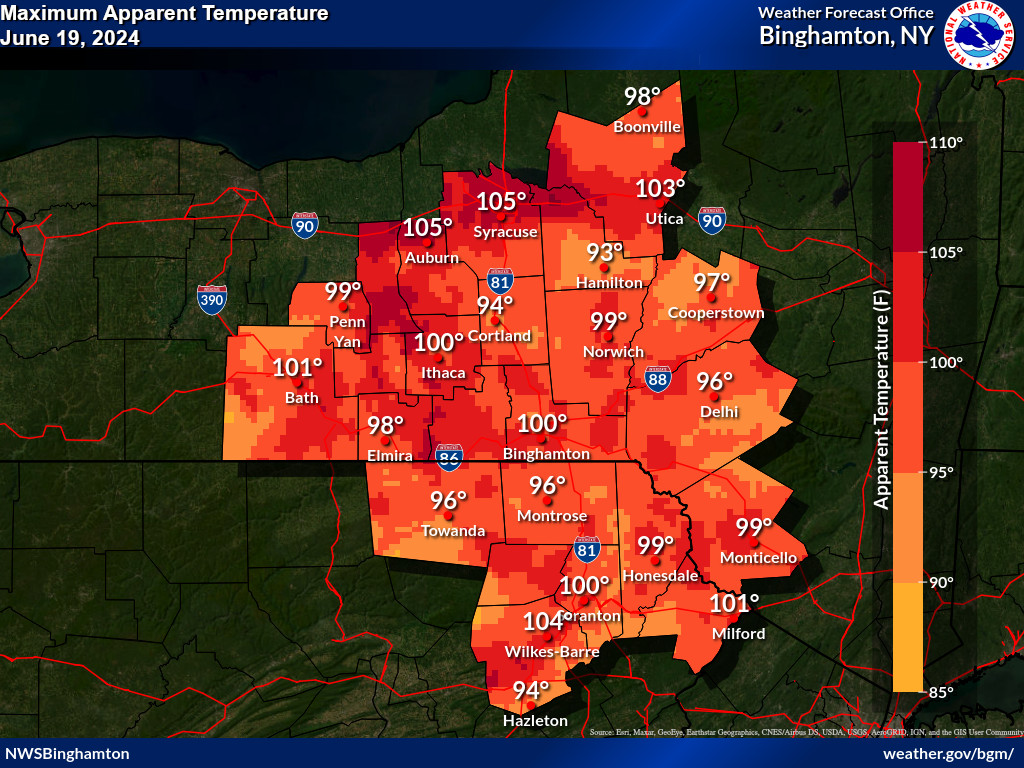
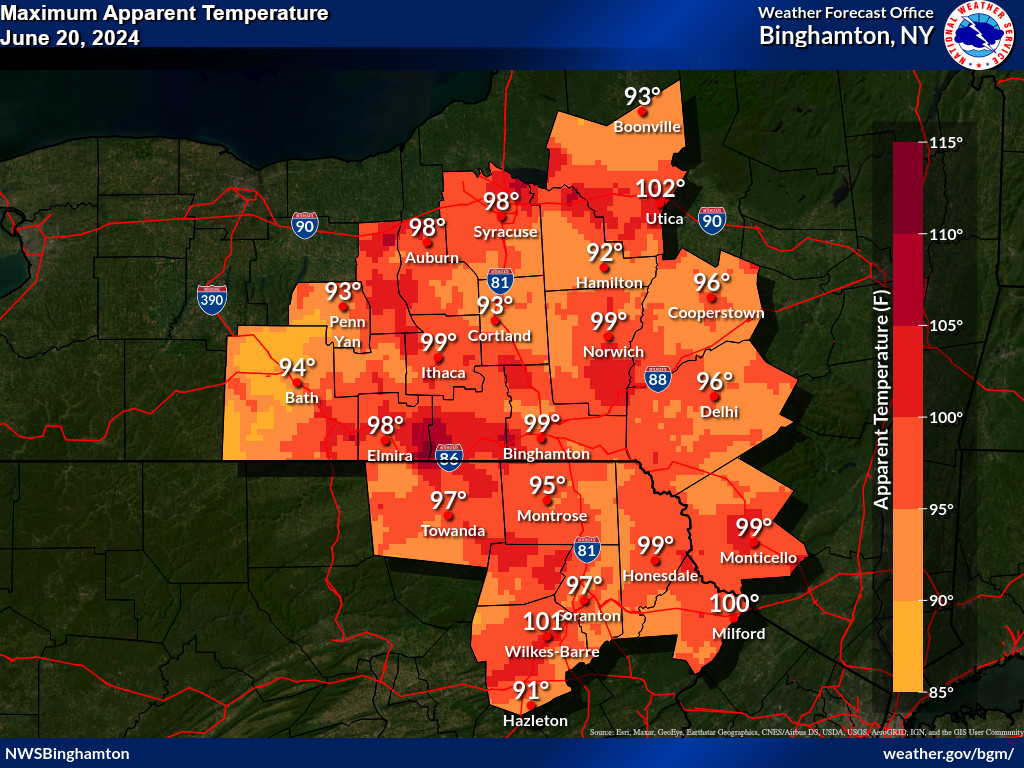
A large area of high pressure remained over the area from June 17 through the 21, 2024. The combination of hot temperatures and high humidities produced heat index values ranging from the upper 90s to 110 F in places.
Cells highlighted in green are either new or tied record temperatures. Cells in red are highlighted to show that they are in the top 10.
|
|
|
|||||||||||||||||||||||||||||||||||||||||||||||||||||||||||||||||||||||||||||||||||||||||||||||||||||||||||||||||||||||||||||||||||||||||||||||||||||||||||||||||||||||||||||||||||||||||||||||||||||||||||||||||||||||||||||||||||||||||||||||||||||||||||||||||||||||||||||||||||||||||||||||||||||||||||||||||||||||||||||||||||||||||||||||||||||||||||||||||||||||||||||||||||||||||||||||||||||||||||||||||||||||||||||||||||||||||||||||||||||||||||||||||||||||||||||||||||||||||||||||||||||||||||||||||||||||||||||||||||||||||||||||||||||||||||||||||||||||||||||||||||||||||||||||||||||||||
Click on each for a larger view.
|
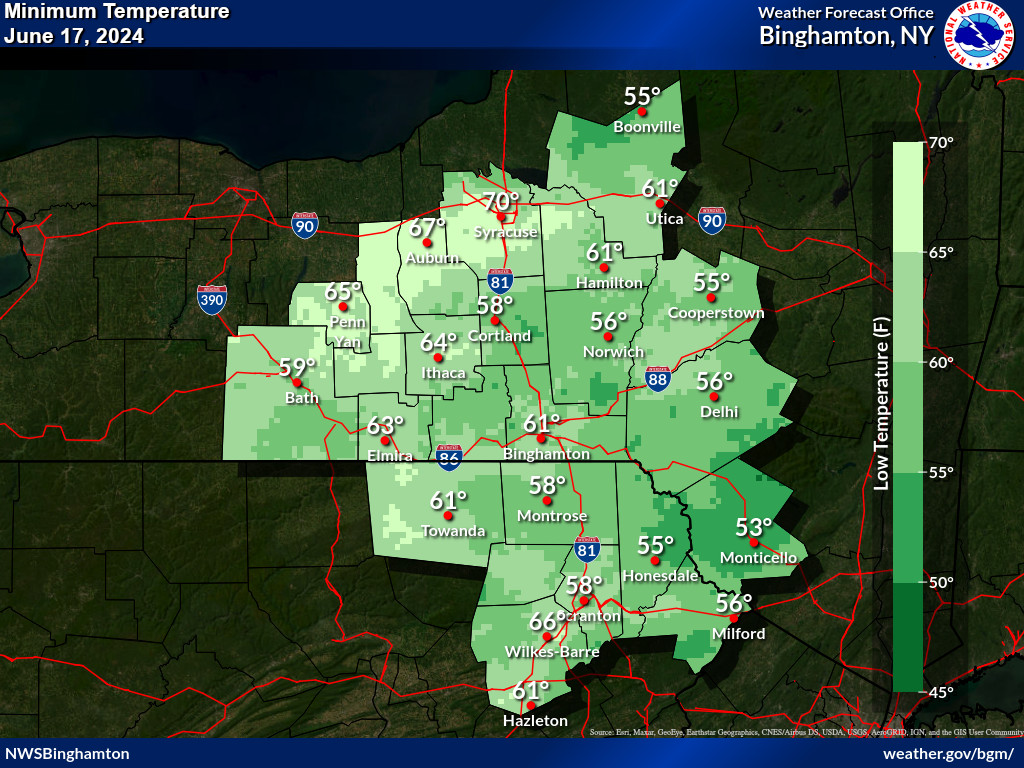
June 17, 2024
|
||
|---|---|---|
| Maximum Temperature | Minimum Temperature | Maximum Apparent Temperature (or Heat Index) |
 |
 |
 |
|
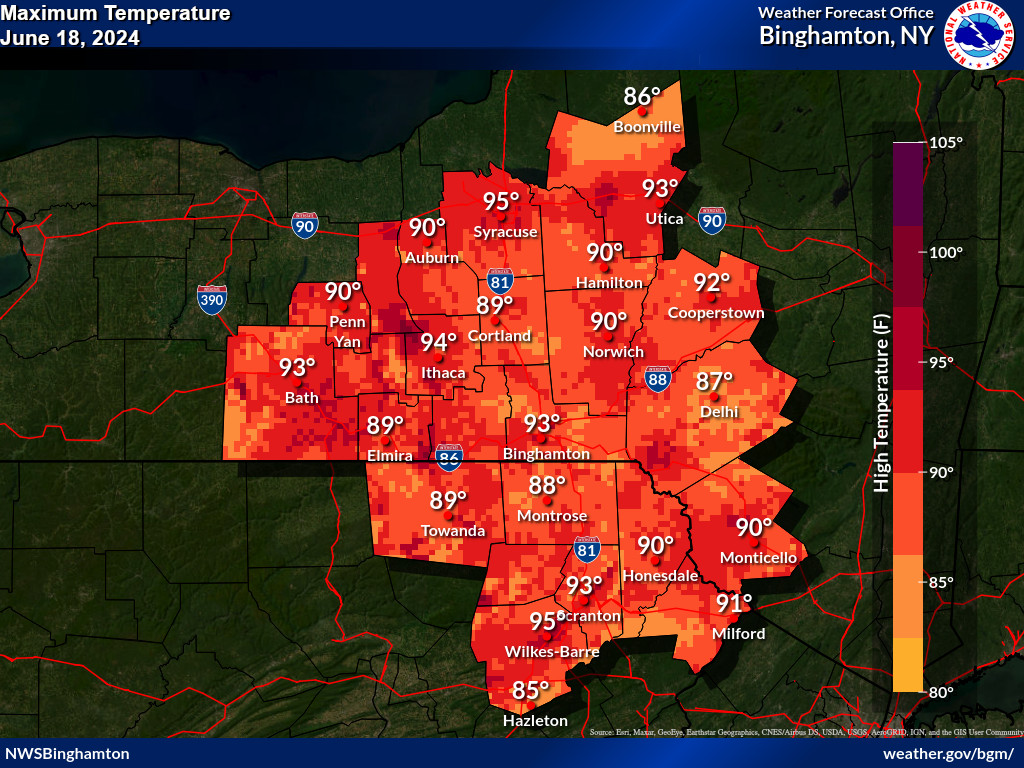
June 18, 2024
|
||
| Maximum Temperature | Minimum Temperature | Maximum Apparent Temperature (or Heat Index) |
 |
 |
 |
|
June 19, 2024
|
||
| Maximum Temperature | Minimum Temperature | Maximum Apparent Temperature (or Heat Index) |
 |
 |
 |
|
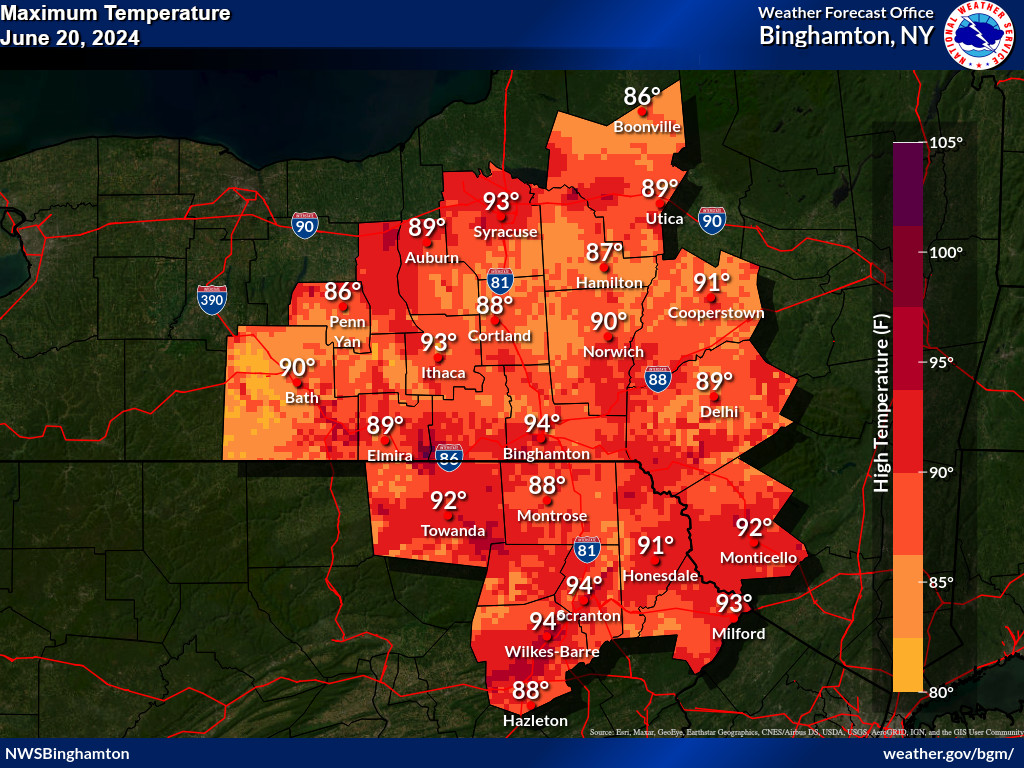
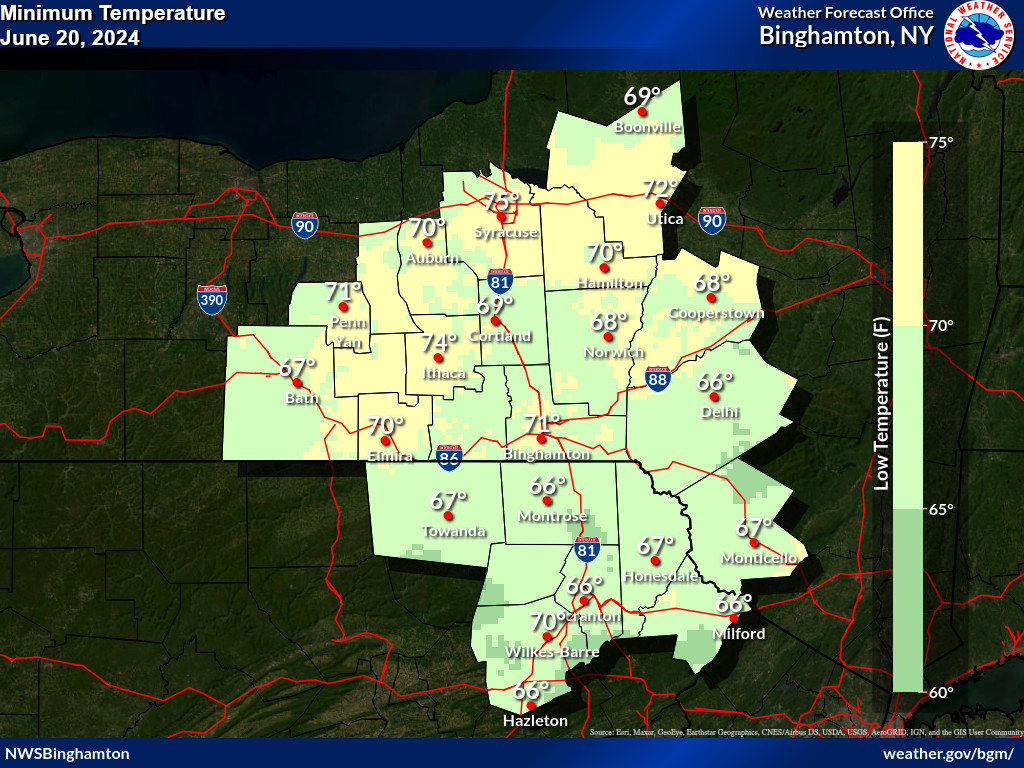
June 20, 2024
|
||
| Maximum Temperature | Minimum Temperature | Maximum Apparent Temperature (or Heat Index) |
 |
 |
 |
Definitions for the graphics above:
Maximum Apparent Temperature - is the maximum apparent temperature ( or in this case Heat Index ) from 8 am to 8 am EDT.
Maximum Temperature - is the maximum temperature from 8 am to 8 pm EDT.
Minimum Temperature - is the minimum temperature from 8 pm to 9 am EDT.
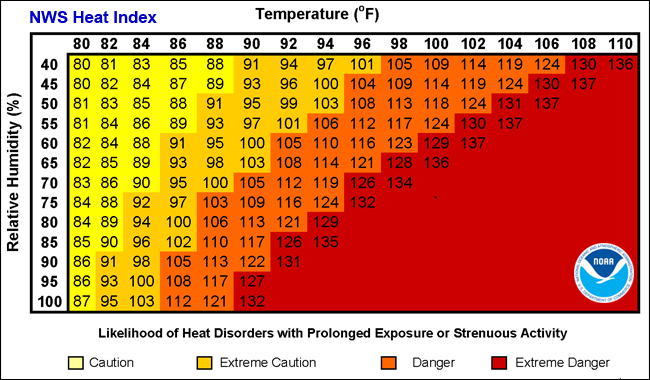
Apparent Temperature - Heat Index - The apparent temperature is used to show heat index. Heat index is an accurate measure of how hot it really feels when the Relative Humidity (RH) is added to the actual air temperature. To find the Heat Index (HI), look at the Heat Index (HI) Chart. As an example, if the air temperature is 90°F (found at the left side of the table) and the Relative Humidity (RH) is 70% (found at the top of the table), the Heat Index (HI)--or how hot it actually feels--is 106°F. This is at the intersection of the row 90°F and the 70% column. This index was devised for shady, light wind conditions. Exposure to full sunshine can increase Heat Index (HI) values by up to 15°F. Also strong winds, particularly with very hot, dry air, can be extremely dangerous. Any value Heat Index (HI) greater than 105°F is in the Danger Category.
Additional information:

