
Record breaking heat wave will continue to affect much of the western United States through this holiday weekend. The heat also lingers for the lower Mississippi Valley and Southern Plains, then shifts over the mid-Atlantic and Southeast. Severe weather and flooding concerns through today for the Midwest, Ohio Valley, and Southern Plains. We continue to closely watch the track of Hurricane Beryl. Read More >
Click here to learn more about ENSO and its impact on northern Arizona's weather.
Sea Surface Temperatures (SSTs) |
Sea Surface Temperature Anomalies |
Madden-Julian Oscillation (MJO) Fact Sheet. Here are the typical MJO temperature and precipitation patterns for the United States.
GFS Phase Diagram |
Ensemble GFS Phase Diagram |
Statistical Phase Diagram for Arizona |
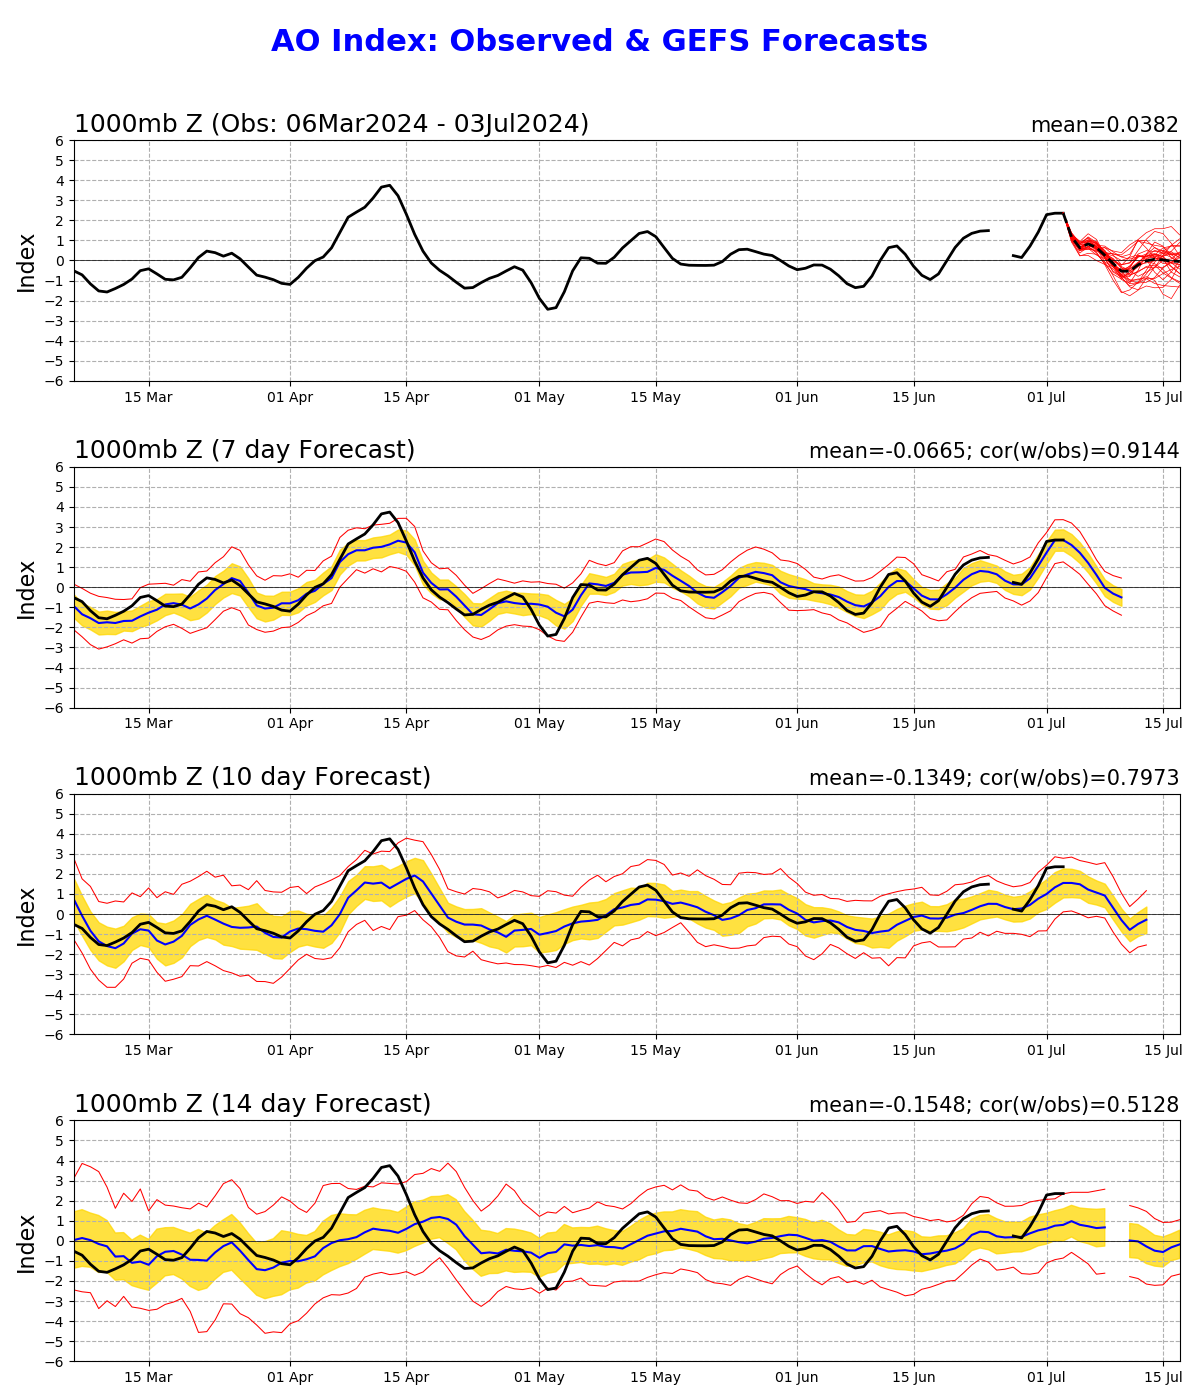
The Arctic Oscillation (AO) refers to an atmospheric circulation pattern over the mid-to-high latitudes of the Northern Hemisphere: the most obvious reflection of the phase of this oscillation is the north-to-south location of the storm-steering, mid-latitude jet stream. Click here to read the impacts on temperature and precipitation patterns across the US based on the AO Phase.
|
500mb Height Anomalies in a Positive AO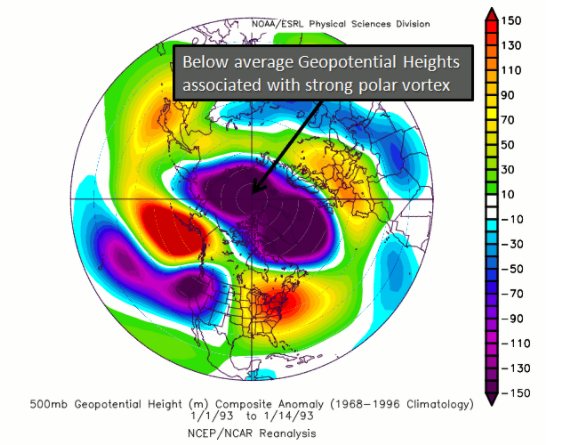
Image Courtesy of the North Carolina Climate Office |
|
500mb Height Anomalies in a Negative AO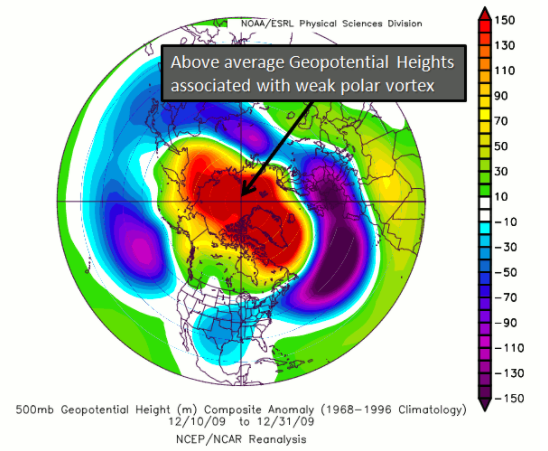
Image Courtesy of the North Carolina Climate Office |
||
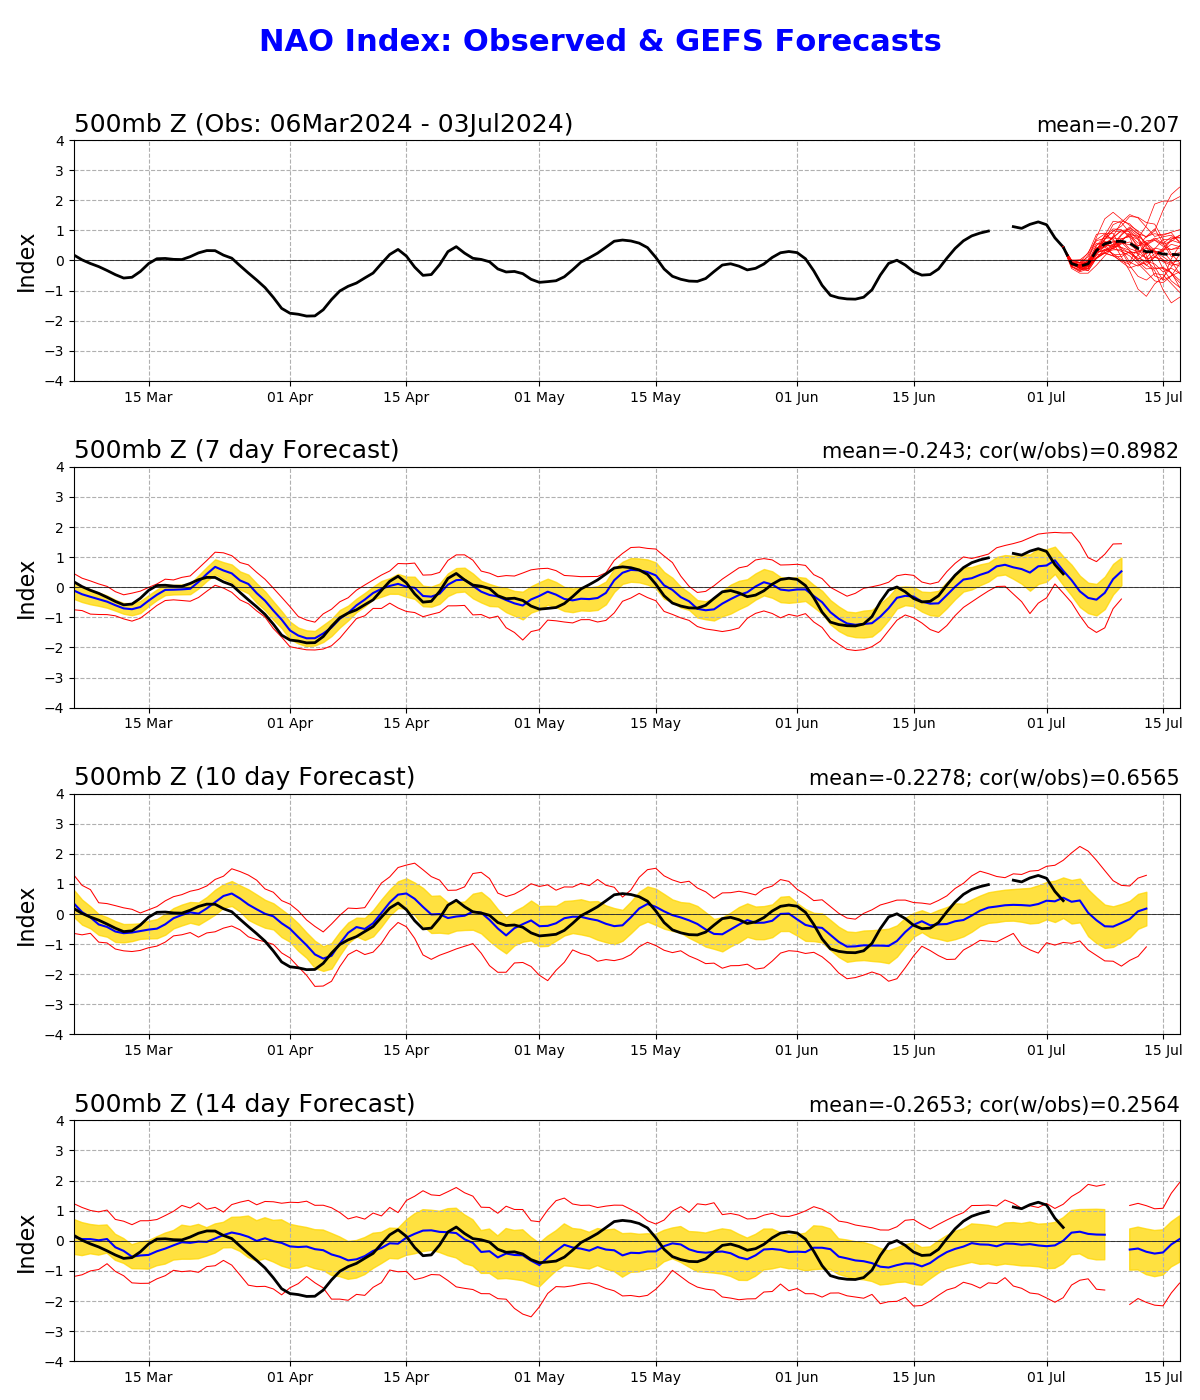
The North Atlantic Oscillation (NAO) index is based on the surface sea-level pressure difference between the Subtropical (Azores) High and the subpolar Low. The positive phase of the NAO reflects below-normal heights and pressure across the high latitudes of the North Atlantic and above-normal heights and pressure over the central North Atlantic and the eastern United States. The negative phase reflects an opposite pattern of height and pressure anomalies over these regions. Both phases of the NAO are associated with basin-wide changes in the intensity and location of the North Atlantic jet stream and storm track, and in large-scale modulations of the normal patterns of zonal and meridional heat and moisture transport, which in turn results in changes in temperature and precipitation patterns especially in eastern North America.
|
500mb Height Anomalies in a Positive NAO
Image Courtesy of the North Carolina Climate Office |
|
500mb Height Anomalies in a Negative NAO
Image Courtesy of the North Carolina Climate Office |
||
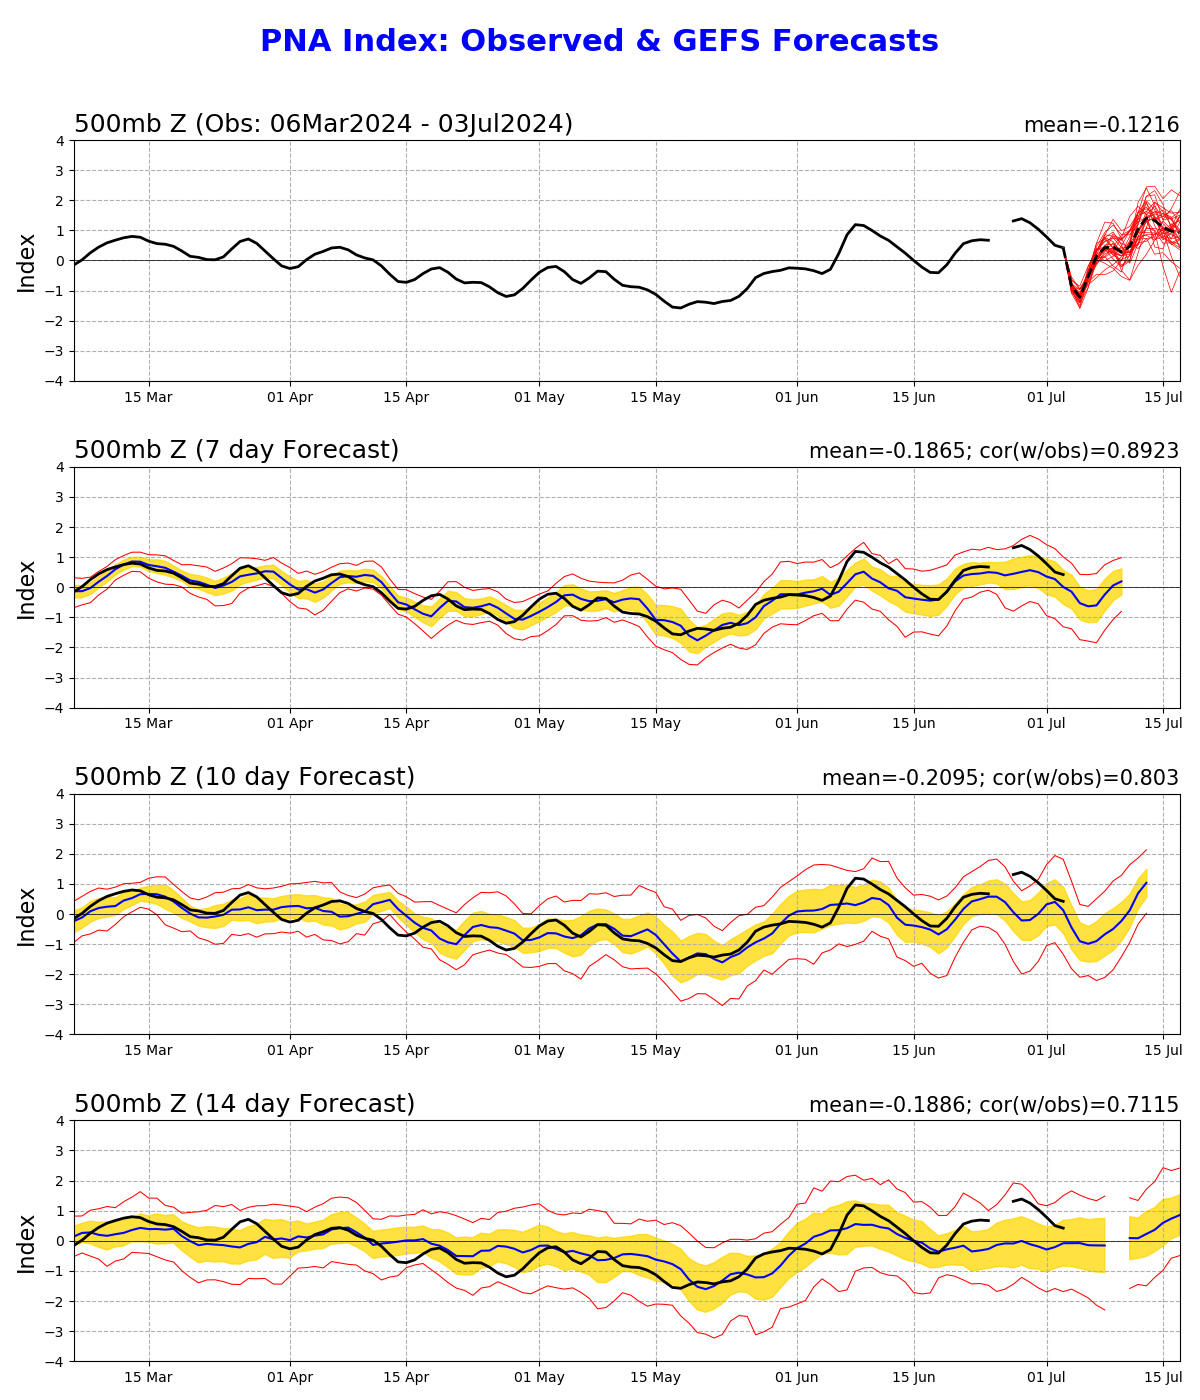
The Pacific-North America (PNA) pattern is one of the most prominent modes of low-frequency variability in the Northern Hemisphere extratropics, appearing in all months except June and July. The PNA index is measured by the height anomalies (generally at 500 and 700 mb) over the western and eastern United States. Research has shown the PNA is strongly influenced by ENSO. Positive PNA patterns are most commonly associated with El Niño while the negative phase tends to occur during La Niñas. Here are the typical and precipitation patterns across the United States.
|
500mb Height Anomalies in a Positive PNA
Image Courtesy of the North Carolina Climate Office |
|
500mb Height Anomalies in a Negative PNA
Image Courtesy of the North Carolina Climate Office |
||

